Real-options-only TSLA call shape optimization. Period: 2019-01-02 to 2025-04-11.
Methodology
Question: Which long-call shape produces the best beat-rate adjusted NAV/max-DD score after measuring how often it beats TSLA buy-and-hold across one-year fresh starts?
Stage 1 keeps target scheduled premium exposure fixed at 10% of NAV, buys weekly, picks the listed expiry nearest the target DTE, and picks the listed strike nearest the target moneyness. Options are held to expiry. Appreciated option positions are not trimmed just because they grow above the scheduled target exposure.
The One-Year Fresh Start audit restarts both the option strategy and TSLA buy-and-hold at $100,000 in each available one-year window. It combines calendar-year windows with July-to-June offset windows to compute the TSLA beat rate. The primary score is final NAV / abs(max drawdown %) multiplied by max(0, 2 * beat rate - 1), with final NAV also used as a tie-breaker and as a separate carry-forward path.
TSLA buy-and-hold is included as the benchmark throughout the report. NAV charts plot it directly; candidate tables include it as a benchmark row; one-year fresh-start, rolling-window, regime, and worst-start tables show TSLA side by side with the option strategy.
Stage 3 take-profit rules operate per option lot. A trigger uses the current real option mid divided by that lot's own entry premium; +300% means a 4x current mid. Repeated thresholds are additive from the original premium, stale marks do not trigger sales, and partial trims use ceil(current contracts * trim %).
Stage 4 trend filters affect only scheduled new purchases. Existing option lots keep their normal expiry or take-profit behavior. The drawdown + MA10 variant buys only when TSLA closes above MA10 and is still at least 20% below its trailing 252-trading-day high.
Stage 5 premium filters use only information available at the buy date. For the selected listed option, the report computes premium divided by spot and compares it with prior observations for the same target expiry and moneyness. Premiums at or above the historical 80th percentile are either bought at half size or skipped, depending on the variant.
Within each stage, the main candidate table is the full audit view. Rows struck through are dominated by another tested row in that same stage across final NAV, max drawdown, and worst relative lag versus TSLA. Winner reads, NAV charts, heatmaps, carry-forward parents, and the Stage 6 audit use only the non-dominated survivor view, with a fallback to the full stage only if no survivor exists.
In Stage 2 onward, blue-highlighted rows are exact carry-overs from the previous stage into the new stage's wider grid.
Stage 1: Expiry x Moneyness Sweep
Stage 1 now tests expiry buckets 7D, 14D, 30D, 60D, and 90D across every base moneyness bucket from 10% ITM to 30% OTM, plus a 60D-only far-OTM extension beyond 30% OTM. The 7D bucket uses one expected open weekly lot, so the scheduled weekly buy is the full target exposure.
Top Stage 1 Candidates
| Strategy | Dominated by | Take profit | Trend filter | Premium filter | Final NAV | Total return | CAGR | Max DD | Drawdown period | Tesla drawdown in that window | Year wins | Beat rate | Base NAV/DD | Beat-rate adjusted NAV / max DD score | Longest negative period | Negative period | Call return in negative period | TSLA return in negative period | Longest TSLA lag | TSLA lag period | Worst lag vs TSLA | Call return in TSLA lag | TSLA return in TSLA lag | Avg DTE | Avg moneyness | Avg prem/spot | Avg prem pctile | Skipped |
|---|---|---|---|---|---|---|---|---|---|---|---|---|---|---|---|---|---|---|---|---|---|---|---|---|---|---|---|---|
| 30D / 20% OTM / 10% exposure | Hold to expiry | No filter | No premium filter | $197,796,346 | 197,696.35% | 235.36% | -82.02% | 2021-11-04 -> 2023-01-06 | -73.35% | 9 | 81.82% | 2,411,630 | 1,534,674 | 582 | 2021-11-04 -> 2023-06-09 | 23.79% | -40.39% | 462 | 2021-11-04 -> 2023-02-09 | -62.16% | -47.11% | -49.43% | 29.64 | 19.86% | 1.67% | 51.12 | 4 | |
| 30D / 25% OTM / 10% exposure | 30D / 20% OTM / 10% exposure | Hold to expiry | No filter | No premium filter | $194,399,516 | 194,299.52% | 234.43% | -90.23% | 2021-11-04 -> 2023-01-06 | -73.35% | 9 | 81.82% | 2,154,572 | 1,371,091 | 589 | 2021-11-04 -> 2023-06-16 | 0.10% | -36.45% | 582 | 2021-11-04 -> 2023-06-09 | -79.54% | -20.66% | -40.39% | 29.64 | 24.77% | 1.20% | 51.24 | 4 |
| 60D / 40% OTM / 10% exposure | Hold to expiry | No filter | No premium filter | $130,933,739 | 130,833.74% | 214.01% | -83.39% | 2021-11-04 -> 2023-01-06 | -73.35% | 8 | 72.73% | 1,570,069 | 713,668 | 1,138 | 2021-11-04 -> 2024-12-16 | 20.92% | 12.94% | 587 | 2020-03-18 -> 2021-10-26 | -55.30% | 1,345.65% | 1,309.51% | 58.65 | 38.18% | 1.62% | 53.15 | 10 | |
| 60D / 35% OTM / 10% exposure | Hold to expiry | No filter | No premium filter | $118,196,831 | 118,096.83% | 208.93% | -80.95% | 2021-11-04 -> 2023-01-06 | -73.35% | 8 | 72.73% | 1,460,211 | 663,732 | 979 | 2021-11-04 -> 2024-07-10 | 1.26% | -35.79% | 588 | 2020-03-18 -> 2021-10-27 | -55.21% | 1,422.66% | 1,336.41% | 58.65 | 33.53% | 1.92% | 52.93 | 10 | |
| 30D / 15% OTM / 10% exposure | Hold to expiry | No filter | No premium filter | $72,627,908 | 72,527.91% | 185.85% | -74.60% | 2021-11-04 -> 2023-01-06 | -73.35% | 9 | 81.82% | 973,500 | 619,500 | 581 | 2021-11-04 -> 2023-06-08 | 1.54% | -42.71% | 590 | 2020-03-18 -> 2021-10-29 | -73.29% | 1,442.54% | 1,441.78% | 29.64 | 14.87% | 2.38% | 50.65 | 4 | |
| 60D / 45% OTM / 10% exposure | 30D / 20% OTM / 10% exposure | Hold to expiry | No filter | No premium filter | $101,579,187 | 101,479.19% | 201.56% | -89.40% | 2021-11-04 -> 2023-01-06 | -73.35% | 8 | 72.73% | 1,136,271 | 516,487 | 1,254 | 2021-11-04 -> 2025-04-11 | -55.15% | -38.46% | 1,254 | 2021-11-04 -> 2025-04-11 | -81.43% | -55.15% | -38.46% | 58.65 | 42.92% | 1.40% | 53.45 | 10 |
| 60D / 30% OTM / 10% exposure | Hold to expiry | No filter | No premium filter | $87,539,130 | 87,439.13% | 194.49% | -77.90% | 2021-11-04 -> 2023-01-06 | -73.35% | 8 | 72.73% | 1,123,793 | 510,815 | 621 | 2021-11-04 -> 2023-07-18 | 0.22% | -28.45% | 589 | 2020-03-18 -> 2021-10-28 | -56.43% | 1,594.87% | 1,390.63% | 58.65 | 28.89% | 2.33% | 52.53 | 10 | |
| 30D / 30% OTM / 10% exposure | 30D / 20% OTM / 10% exposure | Hold to expiry | No filter | No premium filter | $101,562,534 | 101,462.53% | 201.55% | -92.67% | 2021-11-04 -> 2023-01-06 | -73.35% | 8 | 72.73% | 1,095,921 | 498,146 | 1,103 | 2021-11-04 -> 2024-11-11 | 68.48% | -14.63% | 582 | 2021-11-04 -> 2023-06-09 | -84.59% | -30.09% | -40.39% | 29.64 | 29.56% | 0.90% | 51.69 | 4 |
| 60D / 25% OTM / 10% exposure | Hold to expiry | No filter | No premium filter | $47,559,044 | 47,459.04% | 167.19% | -74.54% | 2021-11-04 -> 2023-01-06 | -73.35% | 8 | 72.73% | 638,021 | 290,009 | 593 | 2021-11-04 -> 2023-06-20 | 0.59% | -33.06% | 593 | 2020-03-18 -> 2021-11-01 | -62.09% | 1,853.38% | 1,572.69% | 58.65 | 24.19% | 2.89% | 51.79 | 10 | |
| 30D / 10% OTM / 10% exposure | Hold to expiry | No filter | No premium filter | $20,995,902 | 20,895.90% | 134.54% | -68.61% | 2021-11-04 -> 2023-01-06 | -73.35% | 9 | 81.82% | 306,018 | 194,738 | 581 | 2021-11-04 -> 2023-06-08 | 0.12% | -42.71% | 1,009 | 2020-03-18 -> 2022-12-22 | -71.35% | 422.84% | 420.47% | 29.64 | 9.96% | 3.42% | 50.12 | 4 | |
| 60D / 20% OTM / 10% exposure | Hold to expiry | No filter | No premium filter | $21,661,732 | 21,561.73% | 135.71% | -70.50% | 2021-11-04 -> 2023-01-06 | -73.35% | 8 | 72.73% | 307,237 | 139,653 | 622 | 2021-11-04 -> 2023-07-19 | 0.36% | -28.96% | 596 | 2020-03-18 -> 2021-11-04 | -64.62% | 1,625.74% | 1,602.20% | 58.65 | 19.45% | 3.63% | 51.29 | 10 | |
| 14D / 10% OTM / 10% exposure | 30D / 20% OTM / 10% exposure | Hold to expiry | No filter | No premium filter | $15,915,097 | 15,815.10% | 124.40% | -88.02% | 2021-01-08 -> 2021-10-11 | -36.15% | 9 | 81.82% | 180,815 | 115,064 | 582 | 2021-11-04 -> 2023-06-09 | 24.77% | -40.39% | 872 | 2021-01-11 -> 2023-06-02 | -87.51% | -14.20% | -20.87% | 15.37 | 9.99% | 1.89% | 53.22 | 2 |
| TSLA buy & hold | Benchmark | Benchmark | Benchmark | $1,220,188 | 1,120.19% | 49.01% | -73.63% | 2021-11-04 -> 2023-01-03 | -73.63% | — | — | 16,572 | 16,572 | 1,133 | 2021-11-04 -> 2024-12-11 | 3.61% | 3.61% | 0 | 2019-01-02 -> 2019-01-02 | 0.00% | 0.00% | 0.00% | — | — | — | — | — |
Top Survivor NAV Curves
Stage 1 Winner One-Year Fresh Starts
| Strategy | Window | Window type | Call return | TSLA return | Excess vs TSLA | Beat TSLA | Call max DD | TSLA max DD | Trades |
|---|---|---|---|---|---|---|---|---|---|
| 30D / 20% OTM / 10% exposure | 2019 | calendar_year | 275.12% | 34.89% | 240.24% | yes | -65.66% | -48.46% | 52 |
| TSLA buy & hold | 2019 | calendar_year | 34.89% | 34.89% | 0.00% | — | -48.46% | -48.46% | — |
| 30D / 20% OTM / 10% exposure | 2019 Jul-Jun | jul_to_jun | 5,056.35% | 375.28% | 4,681.08% | yes | -42.67% | -60.62% | 53 |
| TSLA buy & hold | 2019 Jul-Jun | jul_to_jun | 375.28% | 375.28% | 0.00% | — | -60.62% | -60.62% | — |
| 30D / 20% OTM / 10% exposure | 2020 | calendar_year | 2,075.09% | 720.00% | 1,355.09% | yes | -48.95% | -60.62% | 52 |
| TSLA buy & hold | 2020 | calendar_year | 720.00% | 720.00% | 0.00% | — | -60.62% | -60.62% | — |
| 30D / 20% OTM / 10% exposure | 2020 Jul-Jun | jul_to_jun | 106.43% | 203.43% | -96.99% | no | -57.66% | -36.24% | 52 |
| TSLA buy & hold | 2020 Jul-Jun | jul_to_jun | 203.43% | 203.43% | 0.00% | — | -36.24% | -36.24% | — |
| 30D / 20% OTM / 10% exposure | 2021 | calendar_year | 102.06% | 29.45% | 72.61% | yes | -59.86% | -36.19% | 51 |
| TSLA buy & hold | 2021 | calendar_year | 29.45% | 29.45% | 0.00% | — | -36.19% | -36.19% | — |
| 30D / 20% OTM / 10% exposure | 2021 Jul-Jun | jul_to_jun | 133.55% | -0.66% | 134.21% | yes | -70.53% | -48.89% | 52 |
| TSLA buy & hold | 2021 Jul-Jun | jul_to_jun | -0.66% | -0.66% | 0.00% | — | -48.89% | -48.89% | — |
| 30D / 20% OTM / 10% exposure | 2022 | calendar_year | -52.61% | -69.19% | 16.58% | yes | -67.14% | -72.71% | 52 |
| TSLA buy & hold | 2022 | calendar_year | -69.19% | -69.19% | 0.00% | — | -72.71% | -72.71% | — |
| 30D / 20% OTM / 10% exposure | 2022 Jul-Jun | jul_to_jun | 454.76% | 15.18% | 439.58% | yes | -54.63% | -65.05% | 52 |
| TSLA buy & hold | 2022 Jul-Jun | jul_to_jun | 15.18% | 15.18% | 0.00% | — | -65.05% | -65.05% | — |
| 30D / 20% OTM / 10% exposure | 2023 | calendar_year | 371.61% | 129.85% | 241.76% | yes | -39.69% | -32.72% | 52 |
| TSLA buy & hold | 2023 | calendar_year | 129.85% | 129.85% | 0.00% | — | -32.72% | -32.72% | — |
| 30D / 20% OTM / 10% exposure | 2023 Jul-Jun | jul_to_jun | -66.27% | -29.25% | -37.01% | no | -69.73% | -51.52% | 52 |
| TSLA buy & hold | 2023 Jul-Jun | jul_to_jun | -29.25% | -29.25% | 0.00% | — | -51.52% | -51.52% | — |
| 30D / 20% OTM / 10% exposure | 2024 | calendar_year | 296.58% | 67.93% | 228.65% | yes | -48.48% | -42.76% | 52 |
| TSLA buy & hold | 2024 | calendar_year | 67.93% | 67.93% | 0.00% | — | -42.76% | -42.76% | — |
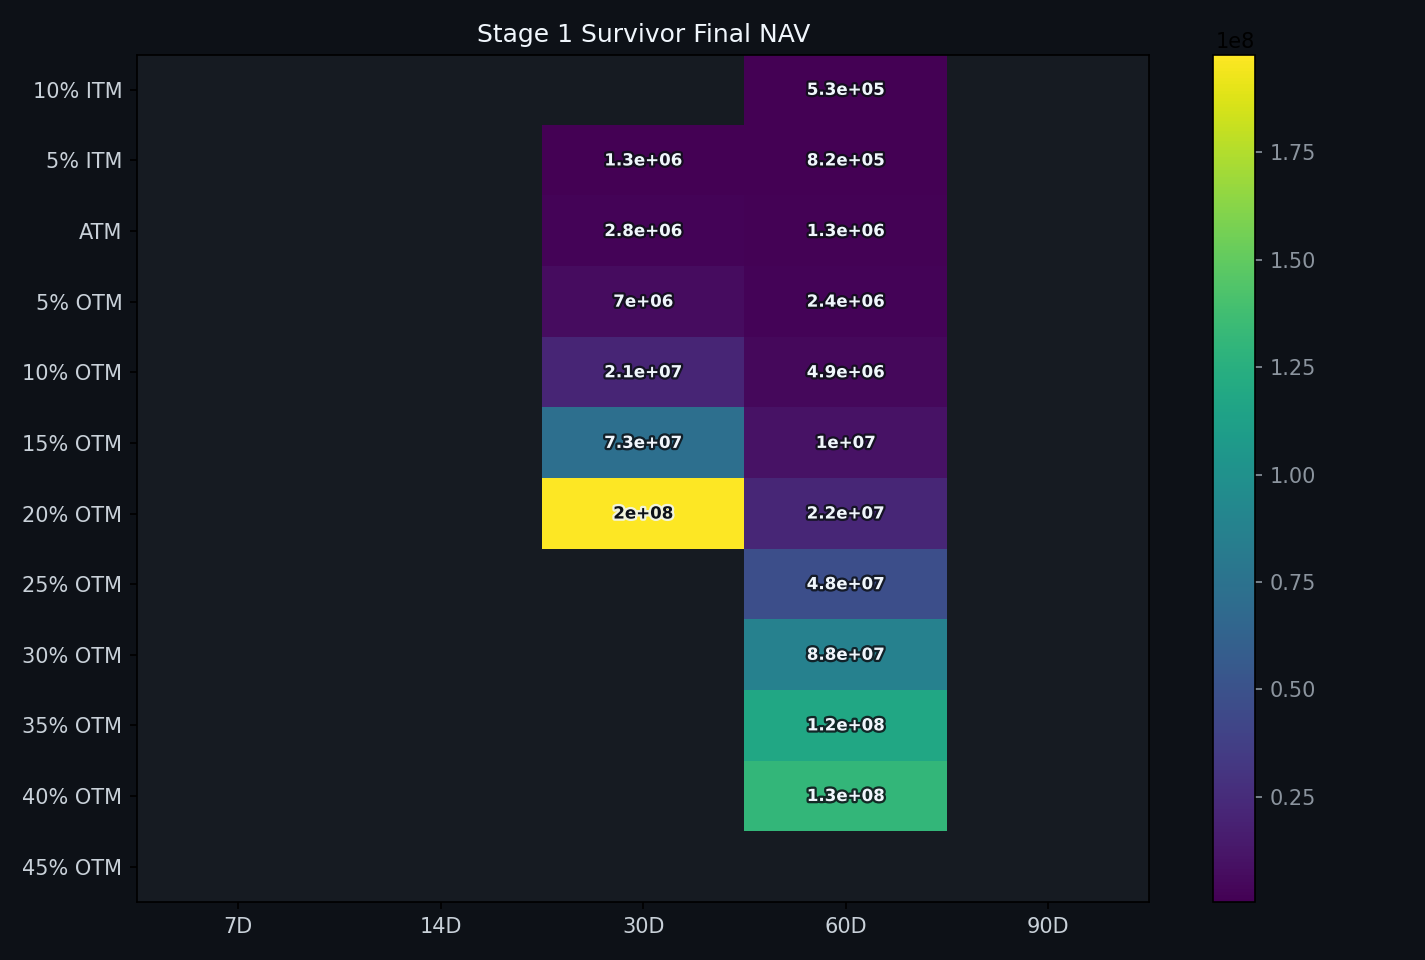
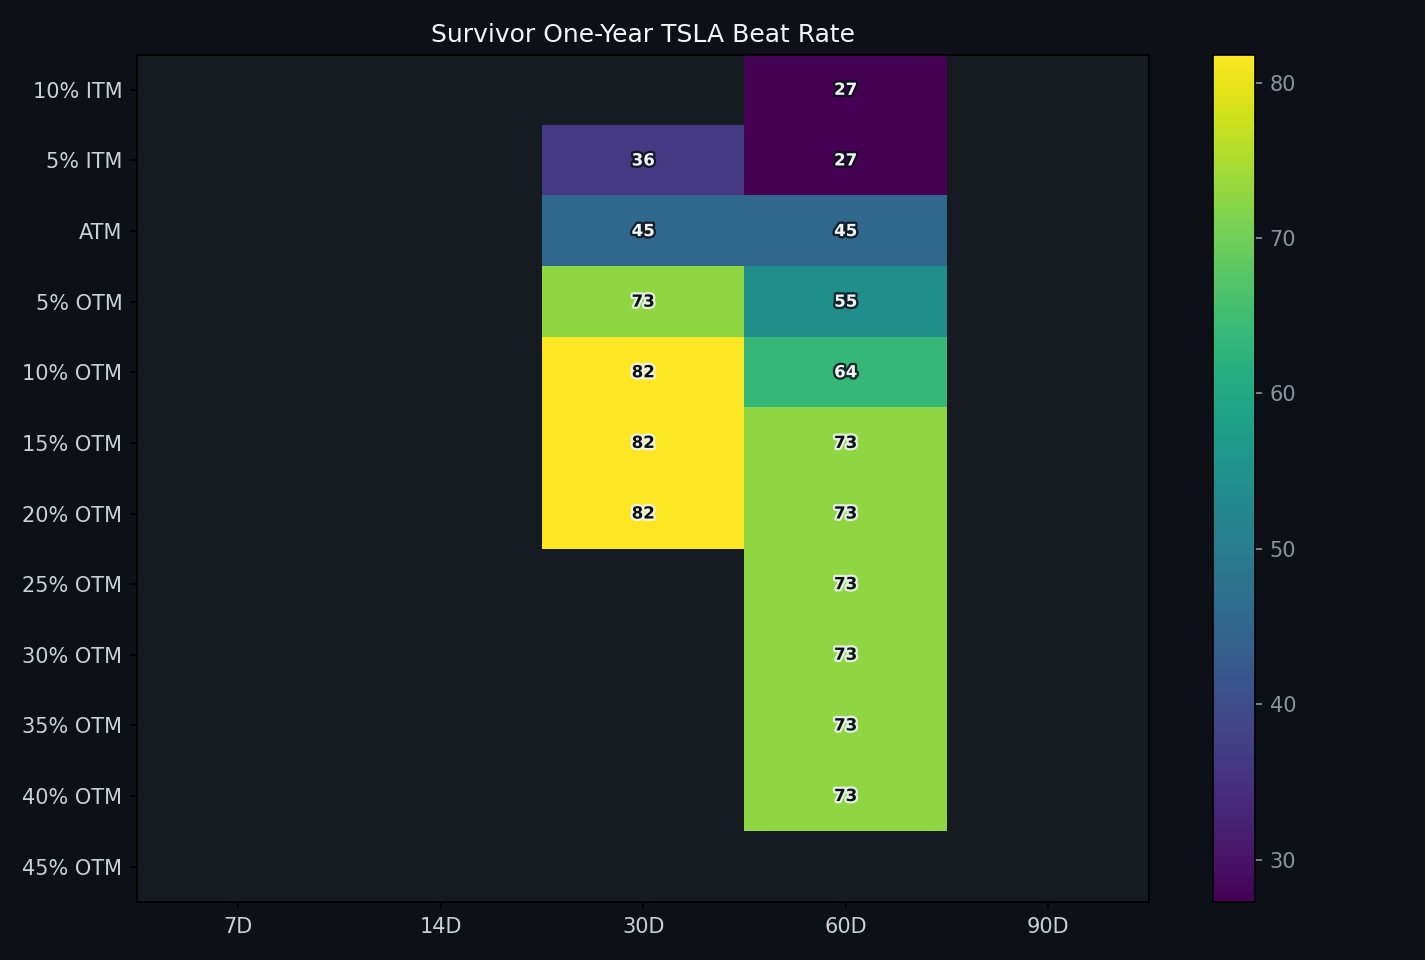
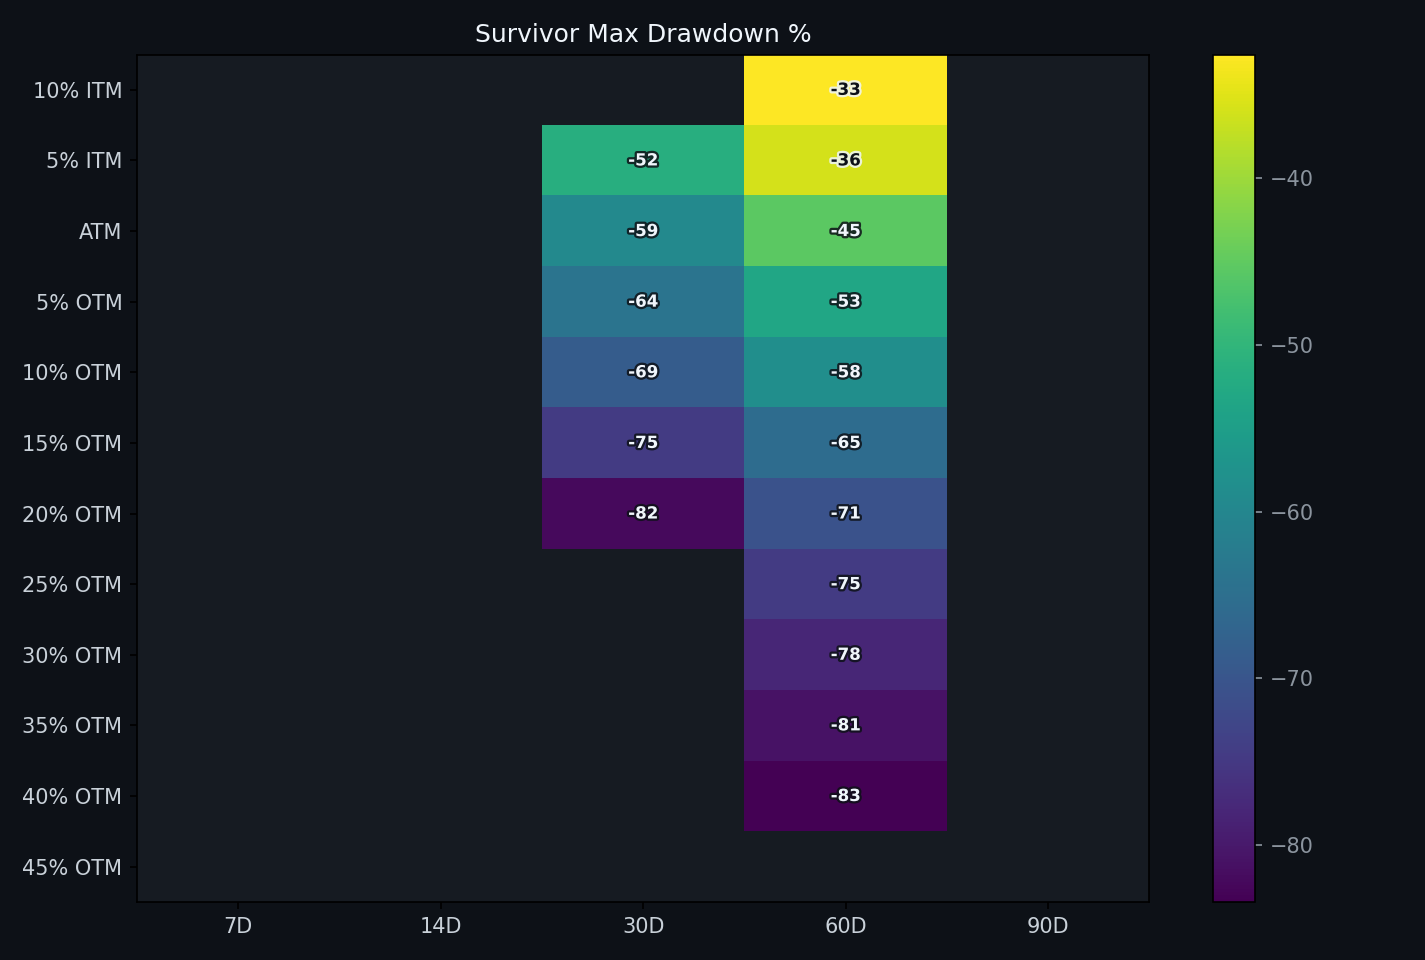
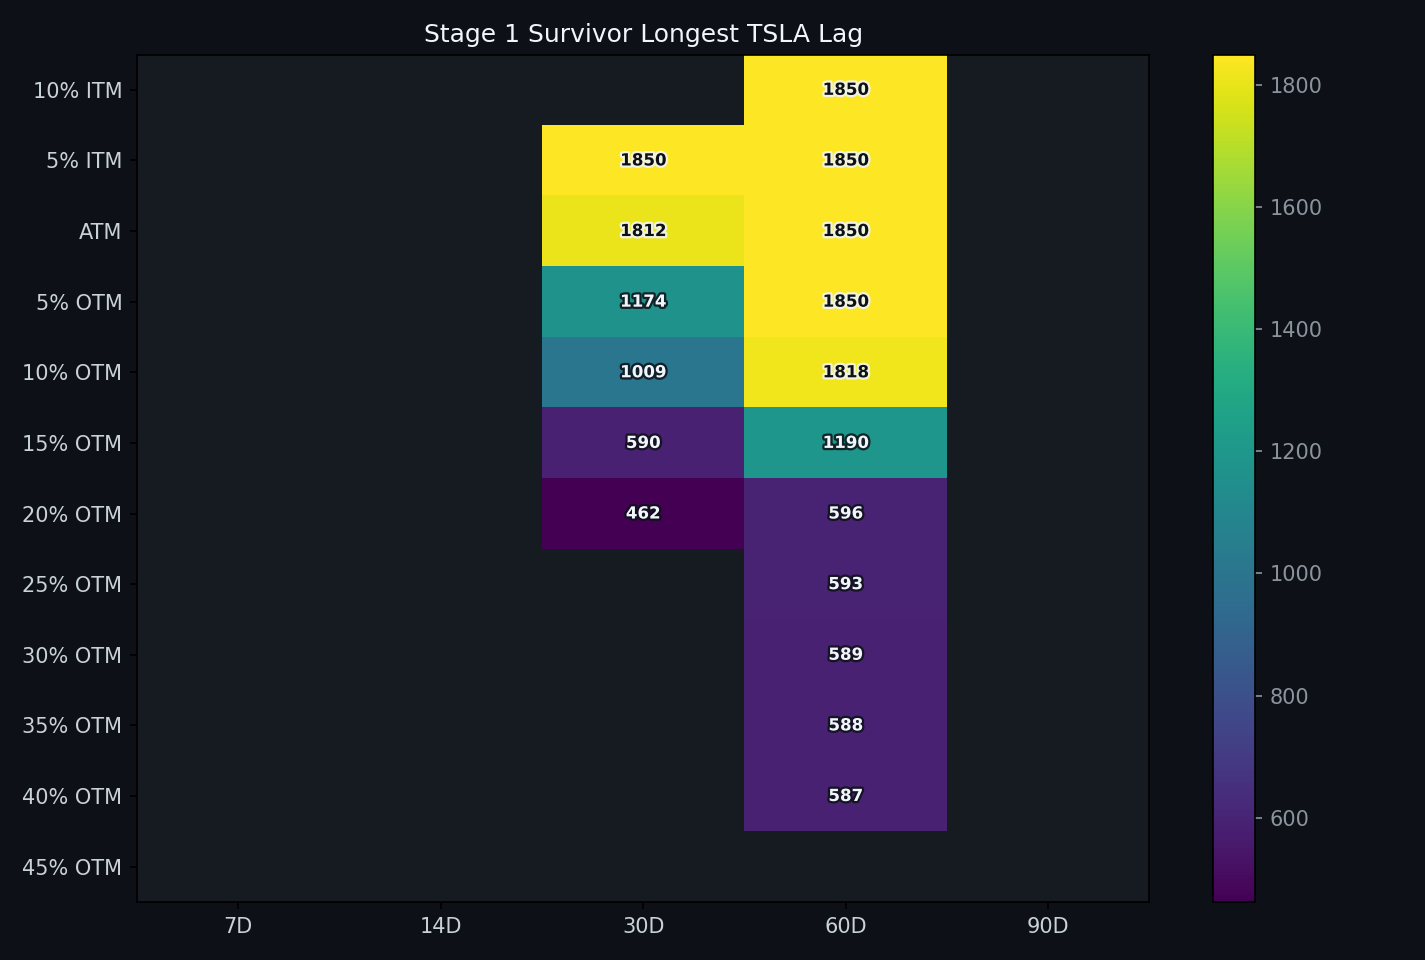
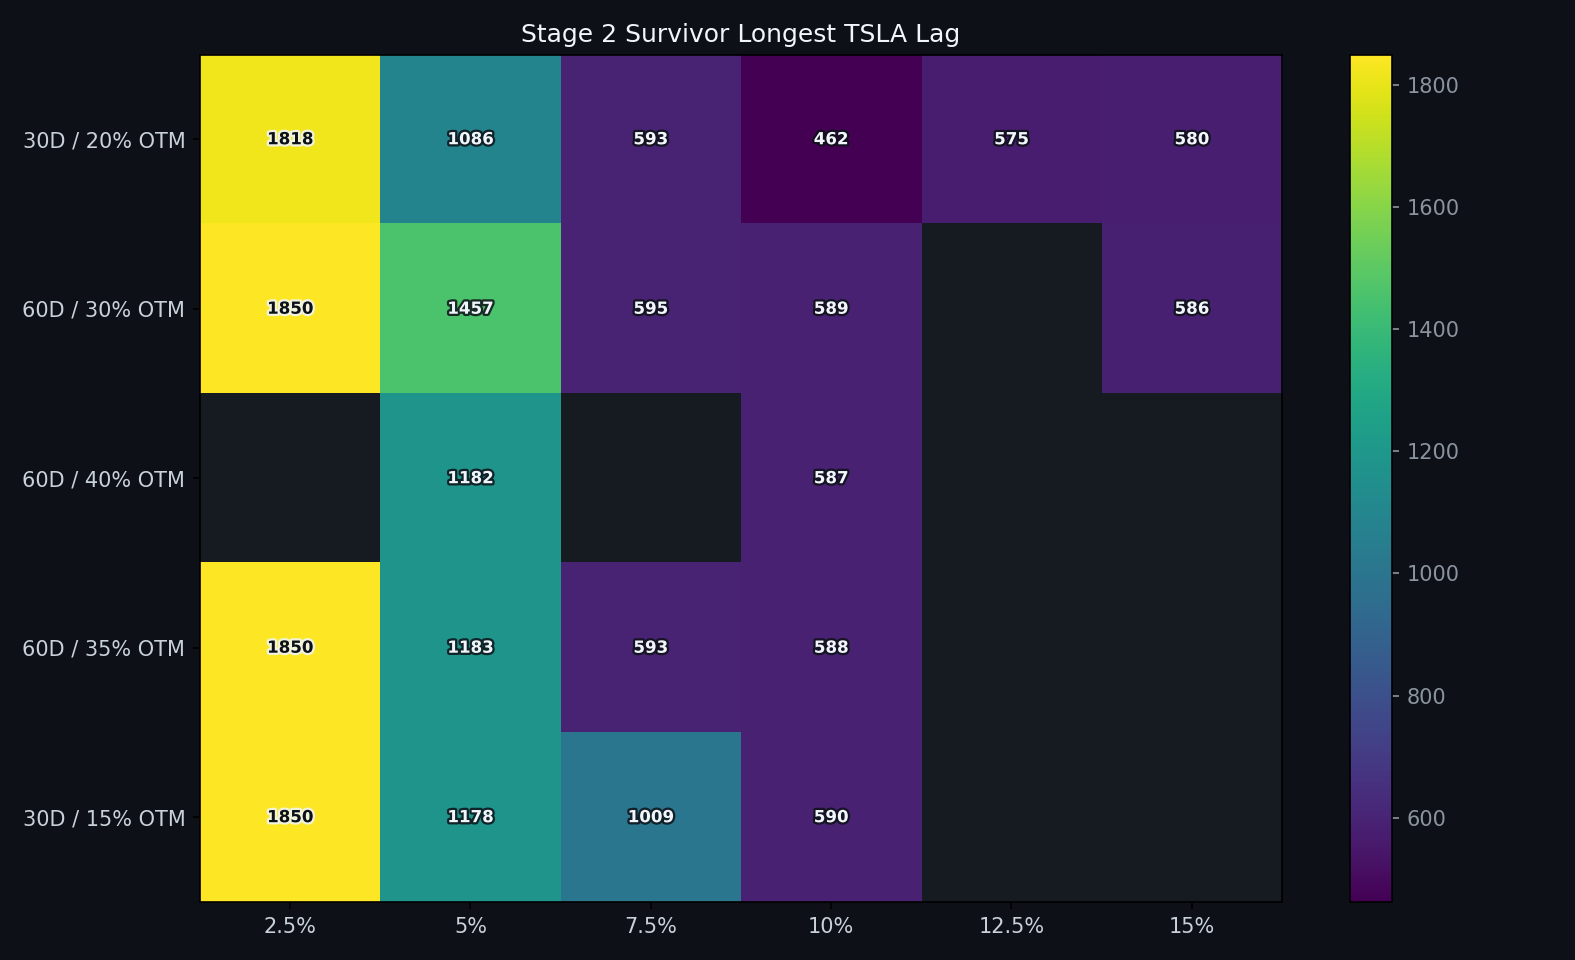
Stage 1 Heatmaps
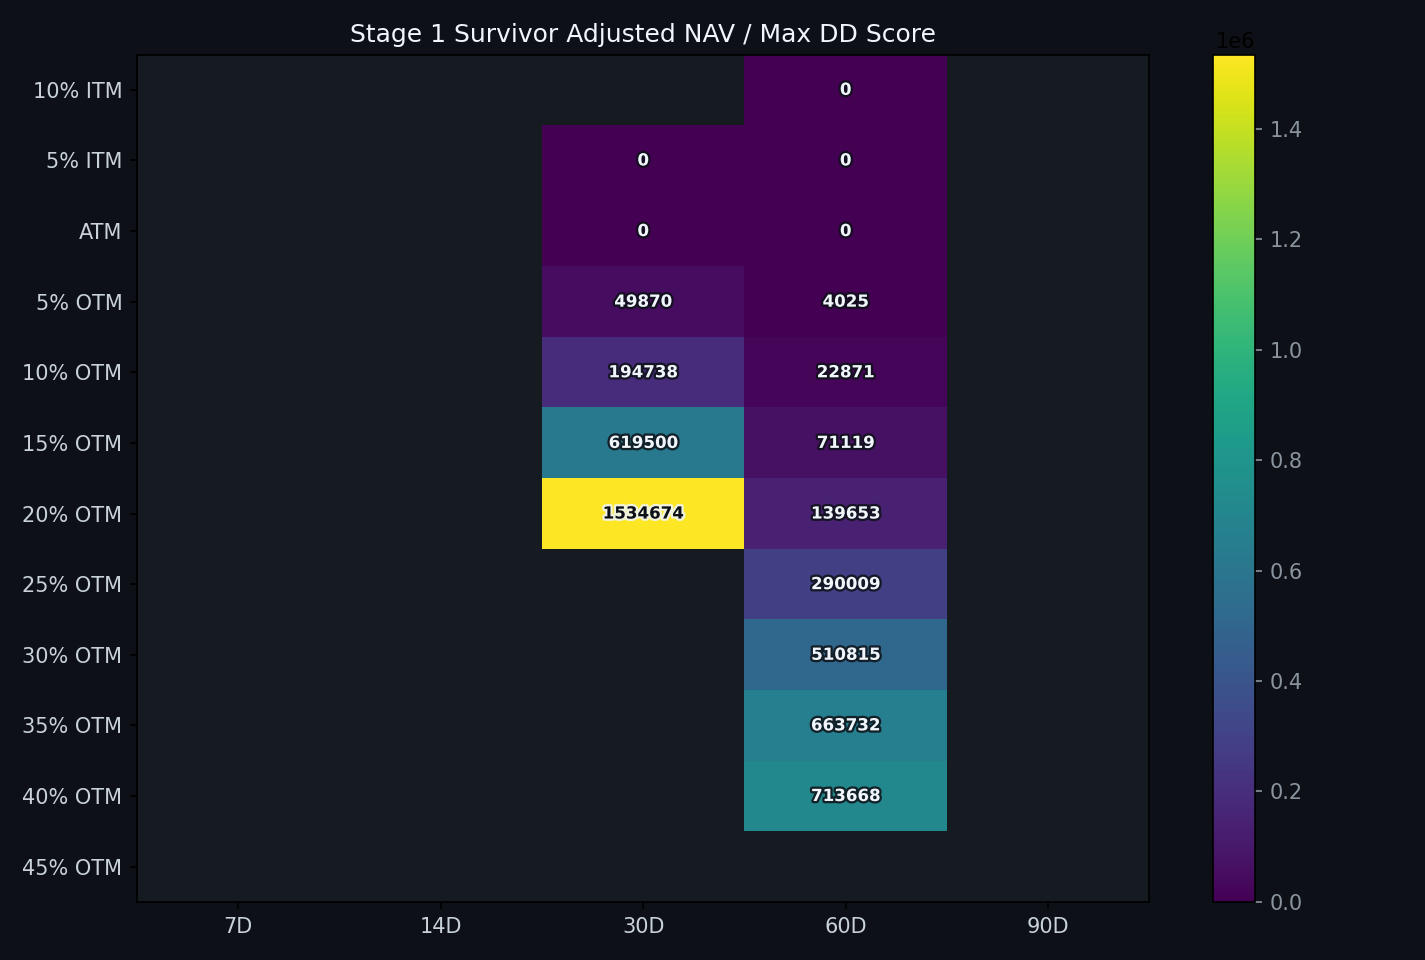
Stage 2: Exposure Sweep On Stage 1 Winners
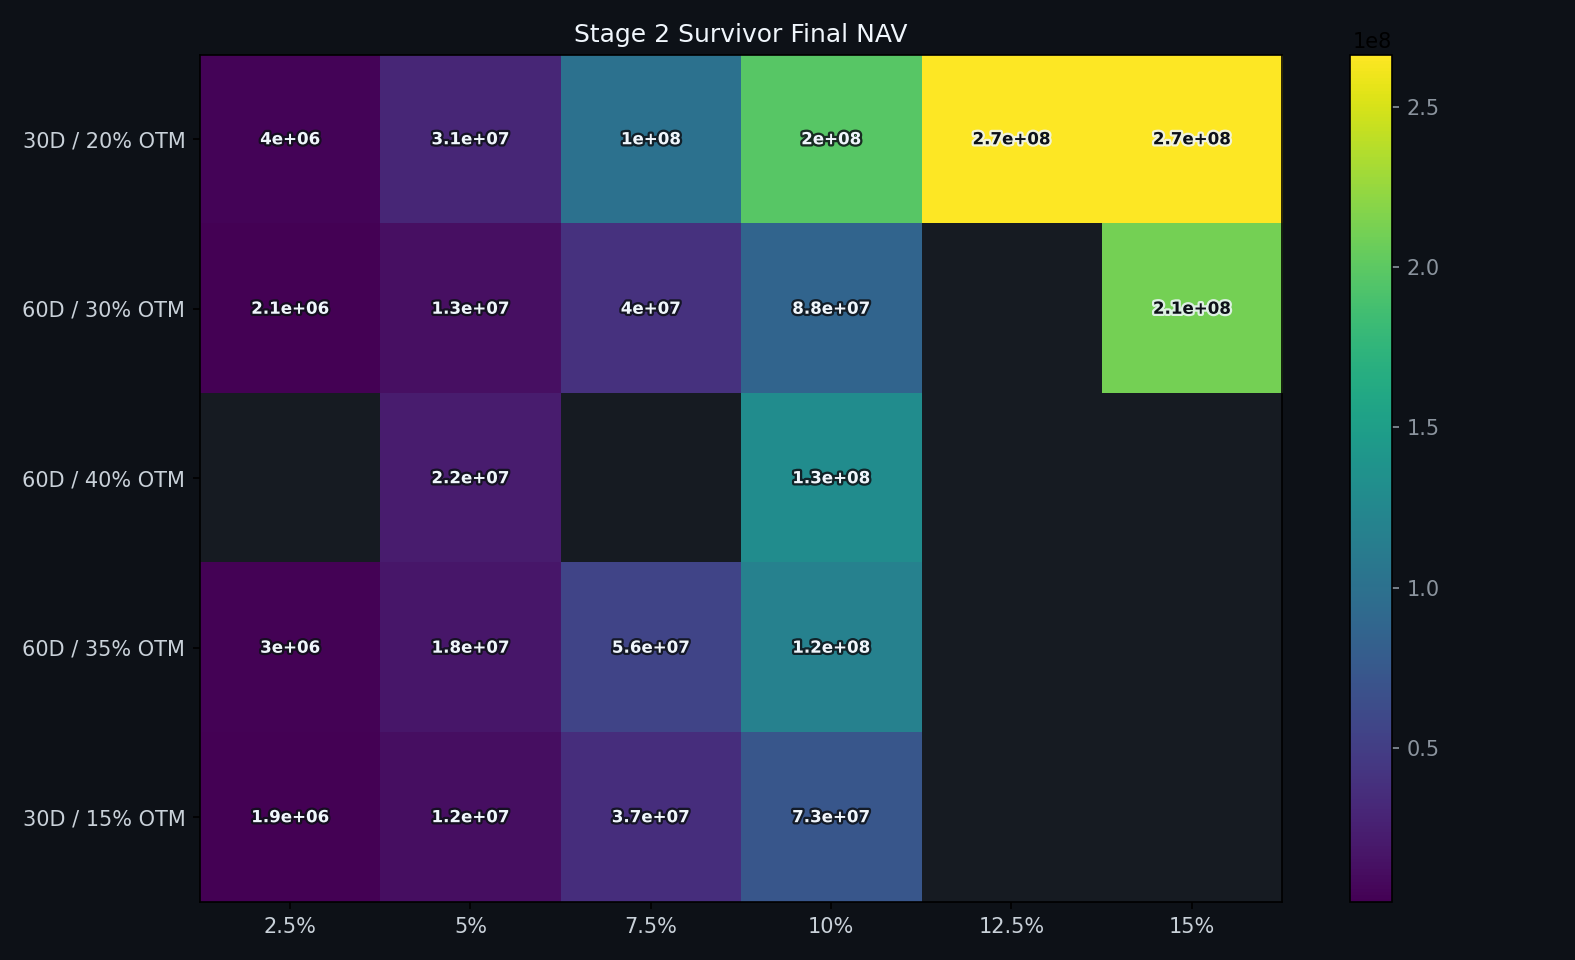
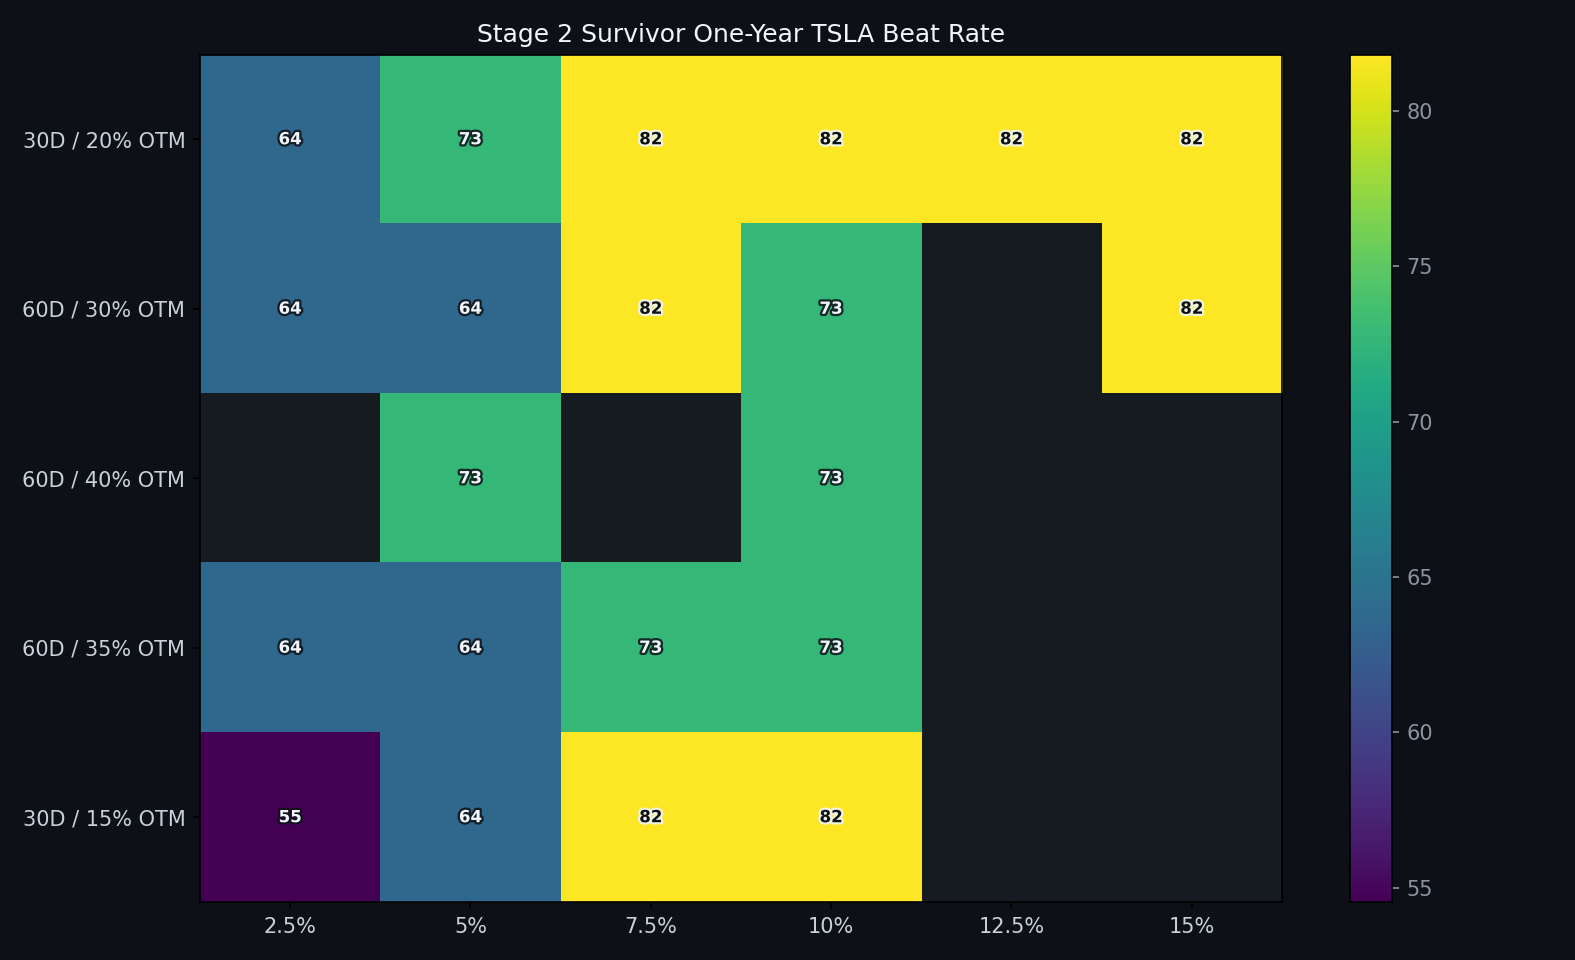
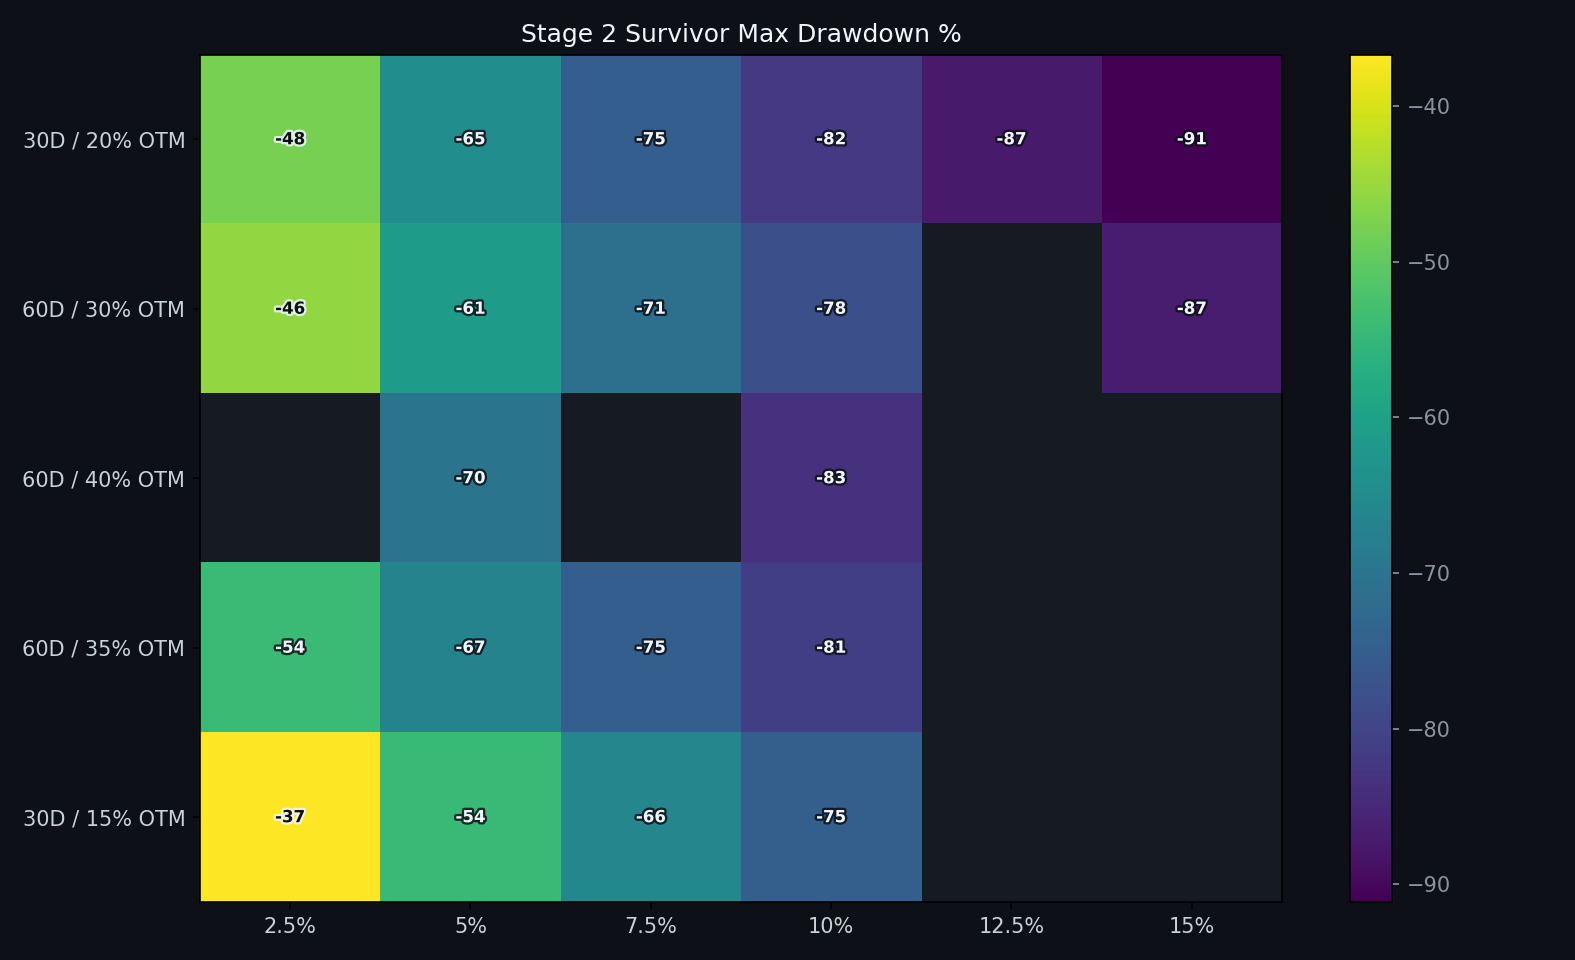
Stage 2 takes the top 5 non-dominated Stage 1 candidates by beat-rate adjusted NAV/max-DD score plus the top 3 by final NAV, de-duplicated, and sweeps target scheduled exposure across 2.5%, 5%, 7.5%, 10%, 12.5%, and 15%. Each candidate is re-run full-window and through the same one-year TSLA-beat audit.
Top Stage 2 Candidates
| Strategy | Dominated by | Take profit | Trend filter | Premium filter | Final NAV | Total return | CAGR | Max DD | Drawdown period | Tesla drawdown in that window | Year wins | Beat rate | Base NAV/DD | Beat-rate adjusted NAV / max DD score | Longest negative period | Negative period | Call return in negative period | TSLA return in negative period | Longest TSLA lag | TSLA lag period | Worst lag vs TSLA | Call return in TSLA lag | TSLA return in TSLA lag | Avg DTE | Avg moneyness | Avg prem/spot | Avg prem pctile | Skipped |
|---|---|---|---|---|---|---|---|---|---|---|---|---|---|---|---|---|---|---|---|---|---|---|---|---|---|---|---|---|
| 30D / 20% OTM / 12.5% exposure | Hold to expiry | No filter | No premium filter | $265,742,054 | 265,642.05% | 251.52% | -87.29% | 2021-11-04 -> 2023-01-06 | -73.35% | 9 | 81.82% | 3,044,435 | 1,937,368 | 582 | 2021-11-04 -> 2023-06-09 | 11.42% | -40.39% | 575 | 2021-11-04 -> 2023-06-02 | -70.35% | -47.73% | -47.81% | 29.64 | 19.86% | 1.67% | 51.12 | 4 | |
| 30D / 20% OTM / 15% exposure | Hold to expiry | No filter | No premium filter | $266,296,725 | 266,196.72% | 251.64% | -91.12% | 2021-11-04 -> 2023-01-06 | -73.35% | 9 | 81.82% | 2,922,342 | 1,859,672 | 586 | 2021-11-04 -> 2023-06-13 | 10.44% | -36.90% | 580 | 2021-11-04 -> 2023-06-07 | -76.99% | -41.78% | -45.22% | 29.64 | 19.86% | 1.67% | 51.12 | 4 | |
| 60D / 35% OTM / 15% exposure | 30D / 20% OTM / 12.5% exposure | Hold to expiry | No filter | No premium filter | $248,185,522 | 248,085.52% | 247.71% | -88.81% | 2021-11-04 -> 2023-01-06 | -73.35% | 9 | 81.82% | 2,794,672 | 1,778,427 | 1,138 | 2021-11-04 -> 2024-12-16 | 5.75% | 12.94% | 587 | 2021-11-04 -> 2023-06-14 | -77.13% | -34.08% | -37.36% | 58.65 | 33.53% | 1.92% | 52.93 | 10 |
| 60D / 30% OTM / 15% exposure | Hold to expiry | No filter | No premium filter | $210,646,972 | 210,546.97% | 238.74% | -86.92% | 2021-11-04 -> 2023-01-06 | -73.35% | 9 | 81.82% | 2,423,523 | 1,542,242 | 1,133 | 2021-11-04 -> 2024-12-11 | 2.24% | 3.61% | 586 | 2021-11-04 -> 2023-06-13 | -72.96% | -30.84% | -36.90% | 58.65 | 28.89% | 2.33% | 52.53 | 10 | |
| 30D / 20% OTM / 10% exposure | Hold to expiry | No filter | No premium filter | $197,796,346 | 197,696.35% | 235.36% | -82.02% | 2021-11-04 -> 2023-01-06 | -73.35% | 9 | 81.82% | 2,411,630 | 1,534,674 | 582 | 2021-11-04 -> 2023-06-09 | 23.79% | -40.39% | 462 | 2021-11-04 -> 2023-02-09 | -62.16% | -47.11% | -49.43% | 29.64 | 19.86% | 1.67% | 51.12 | 4 | |
| 60D / 35% OTM / 12.5% exposure | 30D / 20% OTM / 10% exposure | Hold to expiry | No filter | No premium filter | $189,607,028 | 189,507.03% | 233.11% | -85.40% | 2021-11-04 -> 2023-01-06 | -73.35% | 9 | 81.82% | 2,220,339 | 1,412,943 | 1,135 | 2021-11-04 -> 2024-12-13 | 4.29% | 6.41% | 586 | 2021-11-04 -> 2023-06-13 | -73.58% | -29.62% | -36.90% | 58.65 | 33.53% | 1.92% | 52.93 | 10 |
| 60D / 40% OTM / 15% exposure | 30D / 20% OTM / 12.5% exposure | Hold to expiry | No filter | No premium filter | $242,748,764 | 242,648.76% | 246.49% | -90.35% | 2021-11-04 -> 2023-01-06 | -73.35% | 8 | 72.73% | 2,686,750 | 1,221,250 | 1,254 | 2021-11-04 -> 2025-04-11 | -57.46% | -38.46% | 660 | 2023-06-21 -> 2025-04-11 | -83.64% | -37.07% | -2.76% | 58.65 | 38.18% | 1.62% | 53.15 | 10 |
| 60D / 30% OTM / 12.5% exposure | 30D / 20% OTM / 10% exposure | Hold to expiry | No filter | No premium filter | $149,653,601 | 149,553.60% | 220.77% | -82.99% | 2021-11-04 -> 2023-01-06 | -73.35% | 9 | 81.82% | 1,803,262 | 1,147,530 | 1,132 | 2021-11-04 -> 2024-12-10 | 2.92% | -2.19% | 582 | 2021-11-04 -> 2023-06-09 | -67.49% | -36.18% | -40.39% | 58.65 | 28.89% | 2.33% | 52.53 | 10 |
| 60D / 40% OTM / 12.5% exposure | 30D / 20% OTM / 12.5% exposure | Hold to expiry | No filter | No premium filter | $198,556,392 | 198,456.39% | 235.56% | -87.35% | 2021-11-04 -> 2023-01-06 | -73.35% | 8 | 72.73% | 2,273,079 | 1,033,218 | 1,138 | 2021-11-04 -> 2024-12-16 | 1.14% | 12.94% | 587 | 2021-11-04 -> 2023-06-14 | -77.87% | -33.63% | -37.36% | 58.65 | 38.18% | 1.62% | 53.15 | 10 |
| 30D / 20% OTM / 7.5% exposure | Hold to expiry | No filter | No premium filter | $100,873,268 | 100,773.27% | 201.22% | -74.76% | 2021-11-04 -> 2023-01-06 | -73.35% | 9 | 81.82% | 1,349,378 | 858,695 | 582 | 2021-11-04 -> 2023-06-09 | 28.88% | -40.39% | 593 | 2020-03-18 -> 2021-11-01 | -76.69% | 1,704.46% | 1,572.69% | 29.64 | 19.86% | 1.67% | 51.12 | 4 | |
| 30D / 15% OTM / 15% exposure | 30D / 20% OTM / 10% exposure | Hold to expiry | No filter | No premium filter | $113,059,033 | 112,959.03% | 206.75% | -86.35% | 2021-11-04 -> 2023-01-06 | -73.35% | 9 | 81.82% | 1,309,374 | 833,238 | 582 | 2021-11-04 -> 2023-06-09 | 4.72% | -40.39% | 575 | 2021-11-04 -> 2023-06-02 | -64.28% | -43.85% | -47.81% | 29.64 | 14.87% | 2.38% | 50.65 | 4 |
| 30D / 15% OTM / 12.5% exposure | 60D / 35% OTM / 10% exposure | Hold to expiry | No filter | No premium filter | $103,703,968 | 103,603.97% | 202.55% | -81.26% | 2021-11-04 -> 2023-01-06 | -73.35% | 9 | 81.82% | 1,276,207 | 812,132 | 582 | 2021-11-04 -> 2023-06-09 | 19.53% | -40.39% | 462 | 2021-11-04 -> 2023-02-09 | -55.99% | -46.60% | -49.43% | 29.64 | 14.87% | 2.38% | 50.65 | 4 |
| 60D / 40% OTM / 10% exposure | Hold to expiry | No filter | No premium filter | $130,933,739 | 130,833.74% | 214.01% | -83.39% | 2021-11-04 -> 2023-01-06 | -73.35% | 8 | 72.73% | 1,570,069 | 713,668 | 1,138 | 2021-11-04 -> 2024-12-16 | 20.92% | 12.94% | 587 | 2020-03-18 -> 2021-10-26 | -55.30% | 1,345.65% | 1,309.51% | 58.65 | 38.18% | 1.62% | 53.15 | 10 | |
| 60D / 35% OTM / 10% exposure | Hold to expiry | No filter | No premium filter | $118,196,831 | 118,096.83% | 208.93% | -80.95% | 2021-11-04 -> 2023-01-06 | -73.35% | 8 | 72.73% | 1,460,211 | 663,732 | 979 | 2021-11-04 -> 2024-07-10 | 1.26% | -35.79% | 588 | 2020-03-18 -> 2021-10-27 | -55.21% | 1,422.66% | 1,336.41% | 58.65 | 33.53% | 1.92% | 52.93 | 10 | |
| 30D / 15% OTM / 10% exposure | Hold to expiry | No filter | No premium filter | $72,627,908 | 72,527.91% | 185.85% | -74.60% | 2021-11-04 -> 2023-01-06 | -73.35% | 9 | 81.82% | 973,500 | 619,500 | 581 | 2021-11-04 -> 2023-06-08 | 1.54% | -42.71% | 590 | 2020-03-18 -> 2021-10-29 | -73.29% | 1,442.54% | 1,441.78% | 29.64 | 14.87% | 2.38% | 50.65 | 4 | |
| 60D / 30% OTM / 10% exposure | Hold to expiry | No filter | No premium filter | $87,539,130 | 87,439.13% | 194.49% | -77.90% | 2021-11-04 -> 2023-01-06 | -73.35% | 8 | 72.73% | 1,123,793 | 510,815 | 621 | 2021-11-04 -> 2023-07-18 | 0.22% | -28.45% | 589 | 2020-03-18 -> 2021-10-28 | -56.43% | 1,594.87% | 1,390.63% | 58.65 | 28.89% | 2.33% | 52.53 | 10 | |
| 30D / 20% OTM / 5% exposure | Hold to expiry | No filter | No premium filter | $30,571,189 | 30,471.19% | 149.02% | -64.53% | 2021-11-04 -> 2023-01-06 | -73.35% | 8 | 72.73% | 473,752 | 215,342 | 582 | 2021-11-04 -> 2023-06-09 | 23.85% | -40.39% | 1,086 | 2020-03-18 -> 2023-03-09 | -81.60% | 623.89% | 617.97% | 29.64 | 19.86% | 1.67% | 51.12 | 4 | |
| 30D / 20% OTM / 2.5% exposure | Hold to expiry | No filter | No premium filter | $4,028,506 | 3,928.51% | 80.26% | -47.94% | 2021-11-04 -> 2023-01-06 | -73.35% | 7 | 63.64% | 84,029 | 22,917 | 582 | 2021-11-04 -> 2023-06-09 | 8.81% | -40.39% | 1,818 | 2020-03-18 -> 2025-03-10 | -86.95% | 857.57% | 822.38% | 29.64 | 19.86% | 1.67% | 51.12 | 4 | |
| 60D / 40% OTM / 7.5% exposure | 60D / 30% OTM / 10% exposure | Hold to expiry | No filter | No premium filter | $65,204,928 | 65,104.93% | 180.98% | -77.97% | 2021-11-04 -> 2023-01-06 | -73.35% | 8 | 72.73% | 836,245 | 380,111 | 1,133 | 2021-11-04 -> 2024-12-11 | 3.32% | 3.61% | 593 | 2020-03-18 -> 2021-11-01 | -63.39% | 2,165.14% | 1,572.69% | 58.65 | 38.18% | 1.62% | 53.15 | 10 |
| 60D / 40% OTM / 5% exposure | Hold to expiry | No filter | No premium filter | $21,631,294 | 21,531.29% | 135.66% | -70.23% | 2021-11-04 -> 2021-11-15 | -17.54% | 8 | 72.73% | 308,020 | 140,009 | 1,133 | 2021-11-04 -> 2024-12-11 | 6.37% | 3.61% | 1,182 | 2020-03-18 -> 2023-06-13 | -74.61% | 999.03% | 974.17% | 58.65 | 38.18% | 1.62% | 53.15 | 10 | |
| 60D / 40% OTM / 2.5% exposure | 30D / 15% OTM / 5% exposure | Hold to expiry | No filter | No premium filter | $3,625,964 | 3,525.96% | 77.26% | -57.84% | 2021-11-04 -> 2021-11-15 | -17.54% | 7 | 63.64% | 62,685 | 17,096 | 1,135 | 2021-11-04 -> 2024-12-13 | 3.11% | 6.41% | 1,850 | 2020-03-18 -> 2025-04-11 | -84.34% | 419.98% | 947.60% | 58.65 | 38.18% | 1.62% | 53.15 | 10 |
| 60D / 35% OTM / 7.5% exposure | Hold to expiry | No filter | No premium filter | $56,105,935 | 56,005.94% | 174.33% | -74.94% | 2021-11-04 -> 2023-01-06 | -73.35% | 8 | 72.73% | 748,695 | 340,316 | 979 | 2021-11-04 -> 2024-07-10 | 6.39% | -35.79% | 593 | 2020-03-18 -> 2021-11-01 | -65.69% | 1,895.64% | 1,572.69% | 58.65 | 33.53% | 1.92% | 52.93 | 10 | |
| 60D / 35% OTM / 5% exposure | Hold to expiry | No filter | No premium filter | $18,139,190 | 18,039.19% | 129.13% | -66.80% | 2021-11-04 -> 2021-11-15 | -17.54% | 7 | 63.64% | 271,528 | 74,053 | 979 | 2021-11-04 -> 2024-07-10 | 4.77% | -35.79% | 1,183 | 2020-03-18 -> 2023-06-14 | -75.92% | 987.44% | 966.20% | 58.65 | 33.53% | 1.92% | 52.93 | 10 | |
| 60D / 35% OTM / 2.5% exposure | Hold to expiry | No filter | No premium filter | $2,976,082 | 2,876.08% | 71.77% | -54.08% | 2021-11-04 -> 2021-11-15 | -17.54% | 7 | 63.64% | 55,028 | 15,008 | 1,132 | 2021-11-04 -> 2024-12-10 | 0.06% | -2.19% | 1,850 | 2020-03-18 -> 2025-04-11 | -85.07% | 403.28% | 947.60% | 58.65 | 33.53% | 1.92% | 52.93 | 10 | |
| 30D / 15% OTM / 7.5% exposure | Hold to expiry | No filter | No premium filter | $36,669,438 | 36,569.44% | 156.34% | -65.91% | 2021-11-04 -> 2023-01-06 | -73.35% | 9 | 81.82% | 556,338 | 354,033 | 580 | 2021-11-04 -> 2023-06-07 | 1.37% | -45.22% | 1,009 | 2020-03-18 -> 2022-12-22 | -77.01% | 449.03% | 420.47% | 29.64 | 14.87% | 2.38% | 50.65 | 4 | |
| 30D / 15% OTM / 5% exposure | Hold to expiry | No filter | No premium filter | $11,758,691 | 11,658.69% | 113.83% | -54.28% | 2021-11-04 -> 2023-01-06 | -73.35% | 7 | 63.64% | 216,618 | 59,078 | 580 | 2021-11-04 -> 2023-06-07 | 2.40% | -45.22% | 1,178 | 2020-03-18 -> 2023-06-09 | -81.72% | 1,019.92% | 914.76% | 29.64 | 14.87% | 2.38% | 50.65 | 4 | |
| 30D / 15% OTM / 2.5% exposure | Hold to expiry | No filter | No premium filter | $1,928,677 | 1,828.68% | 60.29% | -36.70% | 2021-11-04 -> 2023-01-06 | -73.35% | 6 | 54.55% | 52,554 | 4,778 | 581 | 2021-11-04 -> 2023-06-08 | 1.80% | -42.71% | 1,850 | 2020-03-18 -> 2025-04-11 | -86.98% | 538.96% | 947.60% | 29.64 | 14.87% | 2.38% | 50.65 | 4 | |
| 60D / 30% OTM / 7.5% exposure | Hold to expiry | No filter | No premium filter | $39,931,892 | 39,831.89% | 159.85% | -71.09% | 2021-11-04 -> 2023-01-06 | -73.35% | 9 | 81.82% | 561,720 | 357,458 | 593 | 2021-11-04 -> 2023-06-20 | 0.27% | -33.06% | 595 | 2020-03-18 -> 2021-11-03 | -66.77% | 1,672.14% | 1,579.99% | 58.65 | 28.89% | 2.33% | 52.53 | 10 | |
| 60D / 30% OTM / 5% exposure | Hold to expiry | No filter | No premium filter | $12,652,842 | 12,552.84% | 116.35% | -61.29% | 2021-11-04 -> 2023-01-06 | -73.35% | 7 | 63.64% | 206,442 | 56,302 | 593 | 2021-11-04 -> 2023-06-20 | 0.17% | -33.06% | 1,457 | 2020-03-18 -> 2024-03-14 | -76.66% | 600.48% | 574.71% | 58.65 | 28.89% | 2.33% | 52.53 | 10 | |
| 60D / 30% OTM / 2.5% exposure | Hold to expiry | No filter | No premium filter | $2,138,144 | 2,038.14% | 62.95% | -45.58% | 2021-11-04 -> 2021-11-15 | -17.54% | 7 | 63.64% | 46,910 | 12,794 | 978 | 2021-11-04 -> 2024-07-09 | 0.54% | -36.01% | 1,850 | 2020-03-18 -> 2025-04-11 | -85.54% | 349.67% | 947.60% | 58.65 | 28.89% | 2.33% | 52.53 | 10 | |
| TSLA buy & hold | Benchmark | Benchmark | Benchmark | $1,220,188 | 1,120.19% | 49.01% | -73.63% | 2021-11-04 -> 2023-01-03 | -73.63% | — | — | 16,572 | 16,572 | 1,133 | 2021-11-04 -> 2024-12-11 | 3.61% | 3.61% | 0 | 2019-01-02 -> 2019-01-02 | 0.00% | 0.00% | 0.00% | — | — | — | — | — |
Top Stage 2 NAV Curves
Stage 2 Winner One-Year Fresh Starts
| Strategy | Window | Window type | Call return | TSLA return | Excess vs TSLA | Beat TSLA | Call max DD | TSLA max DD | Trades |
|---|---|---|---|---|---|---|---|---|---|
| 30D / 20% OTM / 12.5% exposure | 2019 | calendar_year | 283.82% | 34.89% | 248.93% | yes | -74.33% | -48.46% | 52 |
| TSLA buy & hold | 2019 | calendar_year | 34.89% | 34.89% | 0.00% | — | -48.46% | -48.46% | — |
| 30D / 20% OTM / 12.5% exposure | 2019 Jul-Jun | jul_to_jun | 7,871.10% | 375.28% | 7,495.83% | yes | -47.40% | -60.62% | 53 |
| TSLA buy & hold | 2019 Jul-Jun | jul_to_jun | 375.28% | 375.28% | 0.00% | — | -60.62% | -60.62% | — |
| 30D / 20% OTM / 12.5% exposure | 2020 | calendar_year | 3,342.57% | 720.00% | 2,622.58% | yes | -55.59% | -60.62% | 52 |
| TSLA buy & hold | 2020 | calendar_year | 720.00% | 720.00% | 0.00% | — | -60.62% | -60.62% | — |
| 30D / 20% OTM / 12.5% exposure | 2020 Jul-Jun | jul_to_jun | 123.50% | 203.43% | -79.93% | no | -65.44% | -36.24% | 52 |
| TSLA buy & hold | 2020 Jul-Jun | jul_to_jun | 203.43% | 203.43% | 0.00% | — | -36.24% | -36.24% | — |
| 30D / 20% OTM / 12.5% exposure | 2021 | calendar_year | 77.88% | 29.45% | 48.43% | yes | -69.64% | -36.19% | 51 |
| TSLA buy & hold | 2021 | calendar_year | 29.45% | 29.45% | 0.00% | — | -36.19% | -36.19% | — |
| 30D / 20% OTM / 12.5% exposure | 2021 Jul-Jun | jul_to_jun | 118.07% | -0.66% | 118.73% | yes | -76.12% | -48.89% | 52 |
| TSLA buy & hold | 2021 Jul-Jun | jul_to_jun | -0.66% | -0.66% | 0.00% | — | -48.89% | -48.89% | — |
| 30D / 20% OTM / 12.5% exposure | 2022 | calendar_year | -61.43% | -69.19% | 7.75% | yes | -74.68% | -72.71% | 52 |
| TSLA buy & hold | 2022 | calendar_year | -69.19% | -69.19% | 0.00% | — | -72.71% | -72.71% | — |
| 30D / 20% OTM / 12.5% exposure | 2022 Jul-Jun | jul_to_jun | 540.17% | 15.18% | 524.99% | yes | -62.57% | -65.05% | 52 |
| TSLA buy & hold | 2022 Jul-Jun | jul_to_jun | 15.18% | 15.18% | 0.00% | — | -65.05% | -65.05% | — |
| 30D / 20% OTM / 12.5% exposure | 2023 | calendar_year | 426.15% | 129.85% | 296.30% | yes | -46.85% | -32.72% | 52 |
| TSLA buy & hold | 2023 | calendar_year | 129.85% | 129.85% | 0.00% | — | -32.72% | -32.72% | — |
| 30D / 20% OTM / 12.5% exposure | 2023 Jul-Jun | jul_to_jun | -75.28% | -29.25% | -46.03% | no | -78.63% | -51.52% | 52 |
| TSLA buy & hold | 2023 Jul-Jun | jul_to_jun | -29.25% | -29.25% | 0.00% | — | -51.52% | -51.52% | — |
| 30D / 20% OTM / 12.5% exposure | 2024 | calendar_year | 326.73% | 67.93% | 258.79% | yes | -54.21% | -42.76% | 52 |
| TSLA buy & hold | 2024 | calendar_year | 67.93% | 67.93% | 0.00% | — | -42.76% | -42.76% | — |
Stage 2 Heatmaps

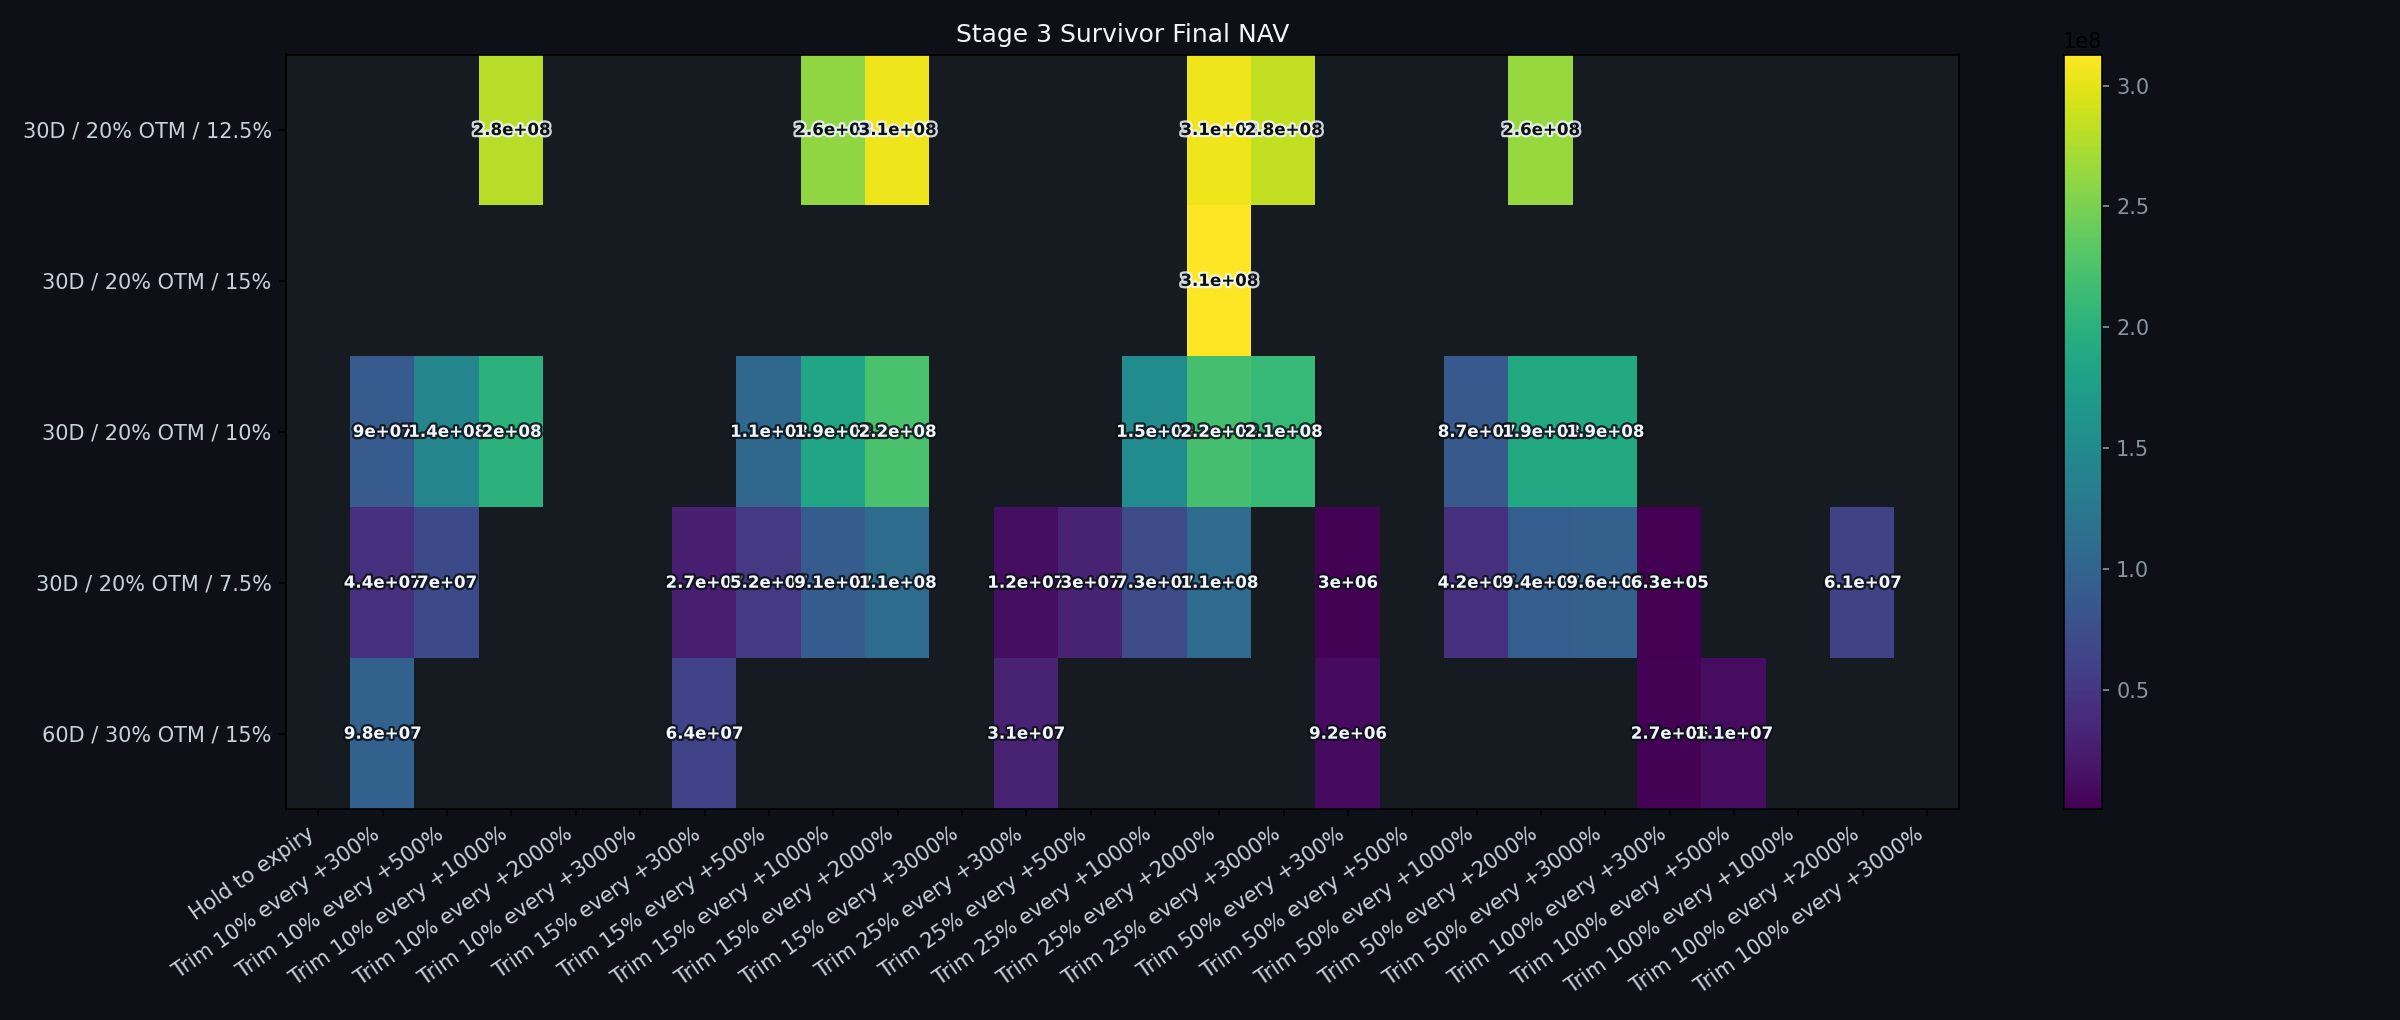
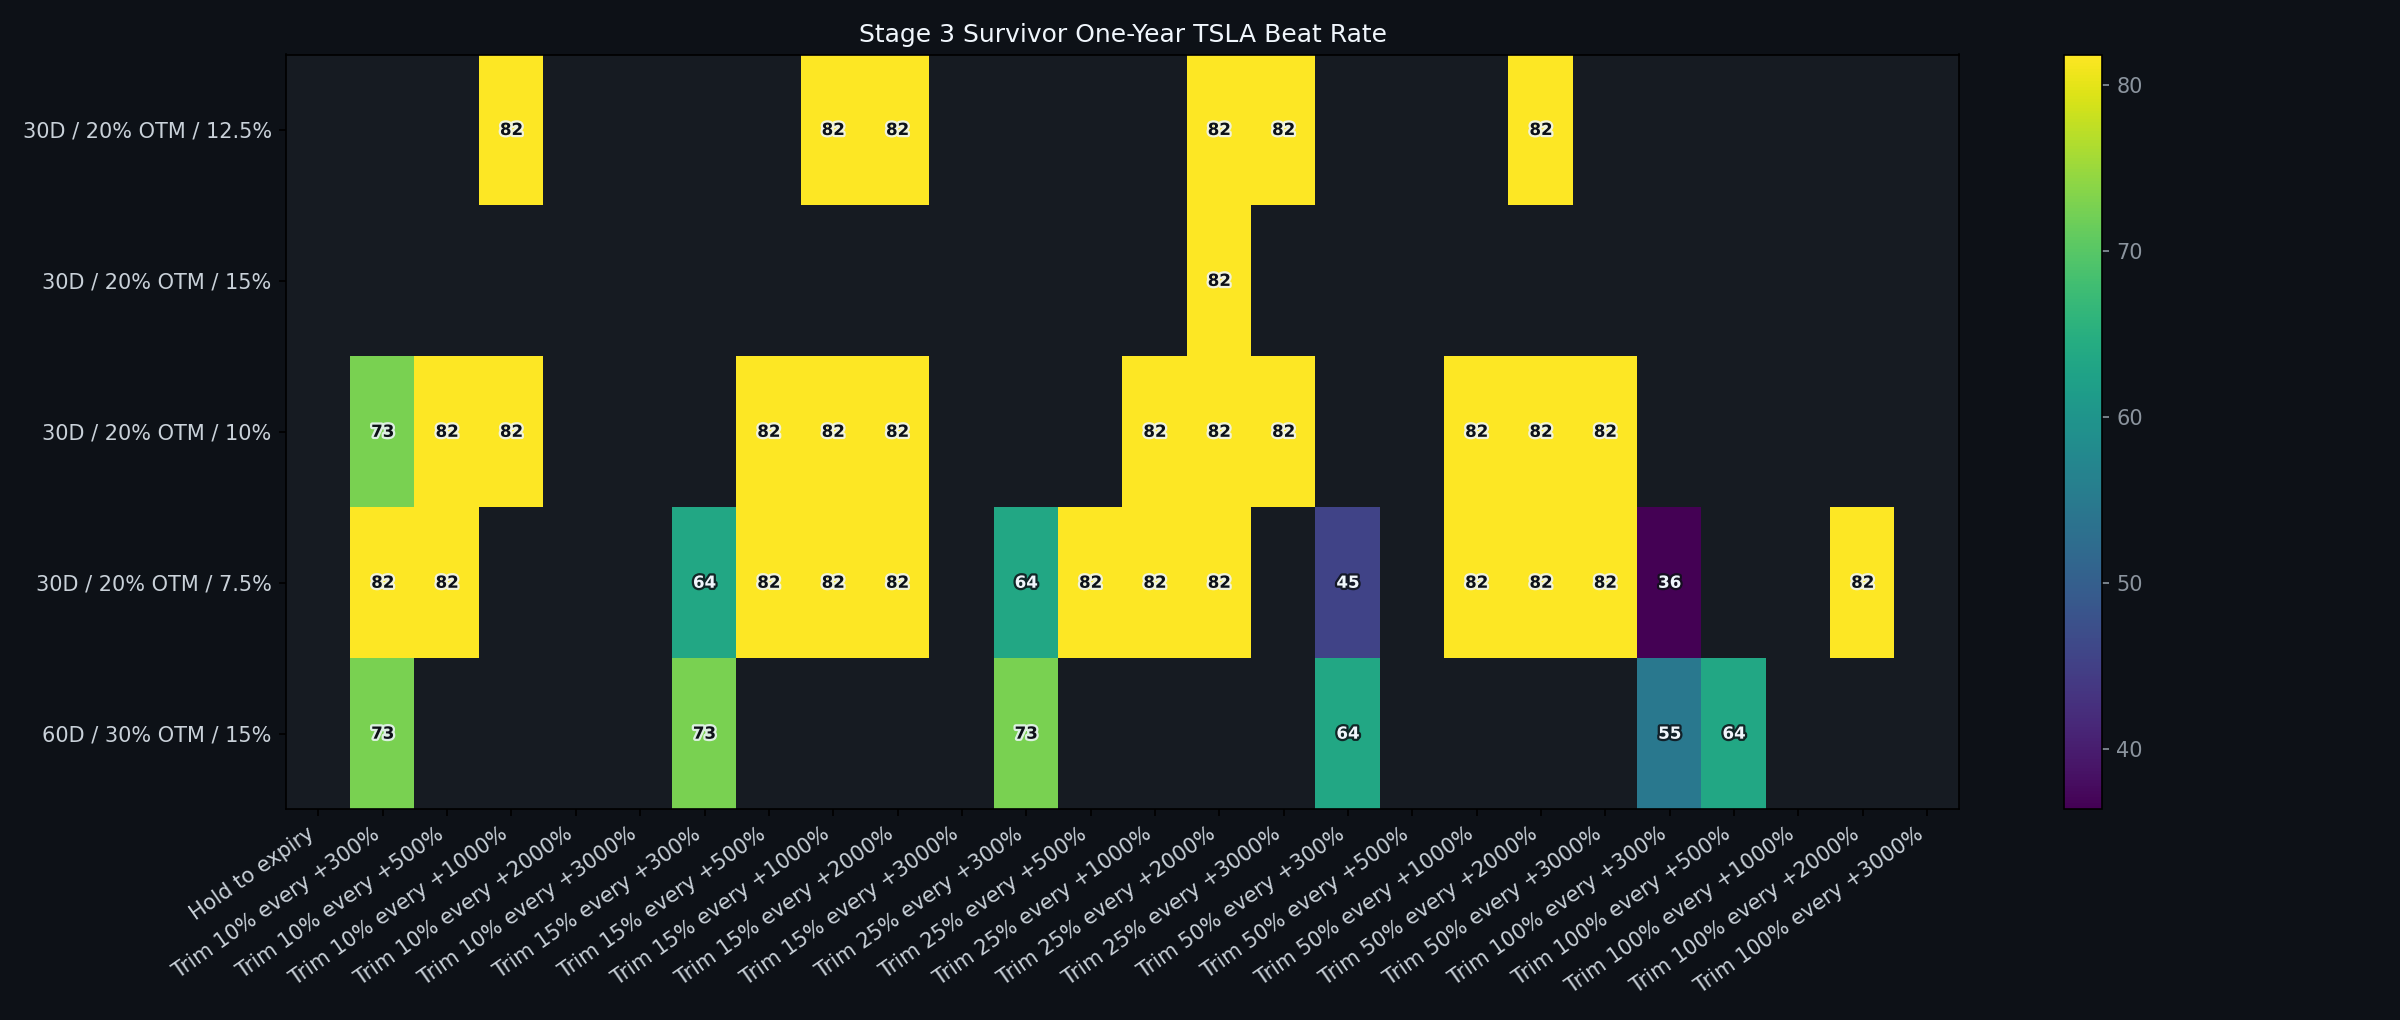
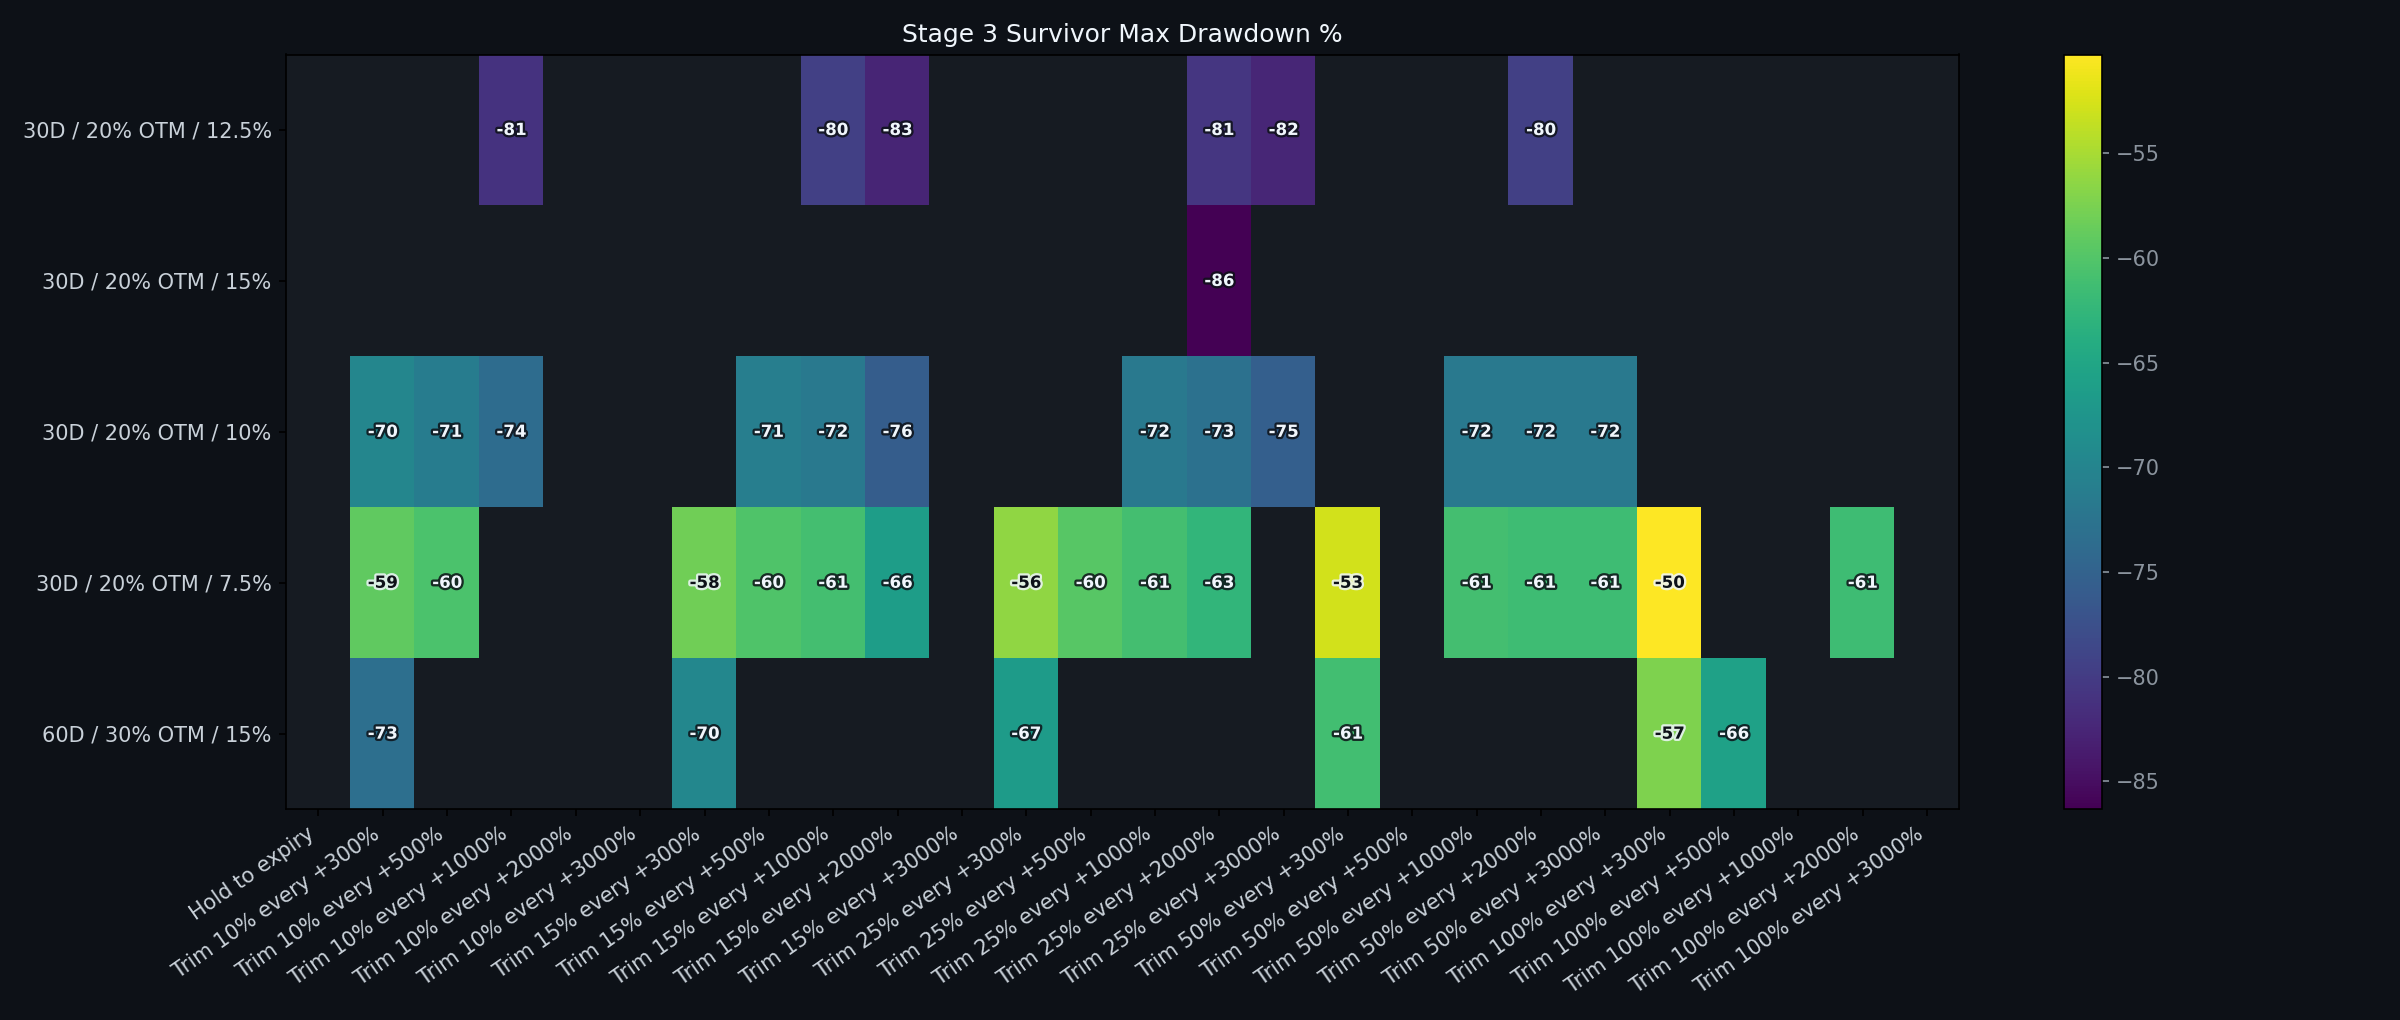
Stage 3: Repeated Take-Profit Trim Rules
Stage 3 takes the top 5 non-dominated Stage 2 candidates by beat-rate adjusted NAV/max-DD score plus the top 3 by final NAV, de-duplicated, and tests hold-to-expiry plus repeated trims of 10%, 15%, 25%, 50%, and 100% every +300%, +500%, +1000%, +2000%, or +3000%. The Hold to expiry row keeps each selected Stage 2 parent in the Stage 3 grid as the baseline. The trigger is per option lot, based only on real same-contract mids versus that lot's entry premium.
Stage 3 Carry-Forward Parents
| Parent strategy | Selected by | Score rank | Final NAV rank | Final NAV | Max DD | Drawdown period | Tesla drawdown in that window | Beat rate | Base NAV/DD | Beat-rate adjusted NAV / max DD score | Longest negative period | Longest TSLA lag | Worst lag vs TSLA |
|---|---|---|---|---|---|---|---|---|---|---|---|---|---|
| 30D / 20% OTM / 12.5% exposure | score + final NAV | 1 | 2 | $265,742,054 | -87.29% | 2021-11-04 -> 2023-01-06 | -73.35% | 81.82% | 3,044,435 | 1,937,368 | 582 | 575 | -70.35% |
| 30D / 20% OTM / 15% exposure | score + final NAV | 2 | 1 | $266,296,725 | -91.12% | 2021-11-04 -> 2023-01-06 | -73.35% | 81.82% | 2,922,342 | 1,859,672 | 586 | 580 | -76.99% |
| 60D / 30% OTM / 15% exposure | score + final NAV | 3 | 3 | $210,646,972 | -86.92% | 2021-11-04 -> 2023-01-06 | -73.35% | 81.82% | 2,423,523 | 1,542,242 | 1,133 | 586 | -72.96% |
| 30D / 20% OTM / 10% exposure | score | 4 | — | $197,796,346 | -82.02% | 2021-11-04 -> 2023-01-06 | -73.35% | 81.82% | 2,411,630 | 1,534,674 | 582 | 462 | -62.16% |
| 30D / 20% OTM / 7.5% exposure | score | 5 | — | $100,873,268 | -74.76% | 2021-11-04 -> 2023-01-06 | -73.35% | 81.82% | 1,349,378 | 858,695 | 582 | 593 | -76.69% |
| TSLA buy & hold | — | — | — | $1,220,188 | -73.63% | 2021-11-04 -> 2023-01-03 | -73.63% | — | 16,572 | 16,572 | 1,133 | 0 | 0.00% |
Top Stage 3 Candidates
| Strategy | Dominated by | Take profit | Trend filter | Premium filter | Final NAV | Total return | CAGR | Max DD | Drawdown period | Tesla drawdown in that window | Year wins | Beat rate | Base NAV/DD | Beat-rate adjusted NAV / max DD score | Longest negative period | Negative period | Call return in negative period | TSLA return in negative period | Longest TSLA lag | TSLA lag period | Worst lag vs TSLA | Call return in TSLA lag | TSLA return in TSLA lag | Avg DTE | Avg moneyness | Avg prem/spot | Avg prem pctile | Skipped |
|---|---|---|---|---|---|---|---|---|---|---|---|---|---|---|---|---|---|---|---|---|---|---|---|---|---|---|---|---|
| 30D / 20% OTM / 12.5% exposure / Trim 25% every +2000% | Trim 25% every +2000% | No filter | No premium filter | $305,346,193 | 305,246.19% | 259.40% | -80.60% | 2021-11-04 -> 2023-01-06 | -73.35% | 9 | 81.82% | 3,788,565 | 2,410,905 | 580 | 2021-11-04 -> 2023-06-07 | 7.75% | -45.22% | 380 | 2023-06-21 -> 2024-07-05 | -61.55% | 2.23% | -3.06% | 29.64 | 19.86% | 1.67% | 51.12 | 4 | |
| 30D / 20% OTM / 12.5% exposure / Trim 15% every +2000% | Trim 15% every +2000% | No filter | No premium filter | $305,437,456 | 305,337.46% | 259.41% | -82.62% | 2021-11-04 -> 2023-01-06 | -73.35% | 9 | 81.82% | 3,697,062 | 2,352,676 | 581 | 2021-11-04 -> 2023-06-08 | 5.69% | -42.71% | 459 | 2021-11-04 -> 2023-02-06 | -59.45% | -49.18% | -52.49% | 29.64 | 19.86% | 1.67% | 51.12 | 4 | |
| 30D / 20% OTM / 15% exposure / Trim 25% every +2000% | Trim 25% every +2000% | No filter | No premium filter | $312,877,165 | 312,777.16% | 260.80% | -86.32% | 2021-11-04 -> 2023-01-06 | -73.35% | 9 | 81.82% | 3,624,471 | 2,306,482 | 582 | 2021-11-04 -> 2023-06-09 | 39.00% | -40.39% | 462 | 2021-11-04 -> 2023-02-09 | -64.55% | -44.47% | -49.43% | 29.64 | 19.86% | 1.67% | 51.12 | 4 | |
| 30D / 20% OTM / 12.5% exposure / Trim 10% every +2000% | 30D / 20% OTM / 12.5% exposure / Trim 25% every +2000% | Trim 10% every +2000% | No filter | No premium filter | $298,895,095 | 298,795.10% | 258.18% | -83.94% | 2021-11-04 -> 2023-01-06 | -73.35% | 9 | 81.82% | 3,560,717 | 2,265,911 | 582 | 2021-11-04 -> 2023-06-09 | 38.03% | -40.39% | 461 | 2021-11-04 -> 2023-02-08 | -62.54% | -50.38% | -50.90% | 29.64 | 19.86% | 1.67% | 51.12 | 4 |
| 30D / 20% OTM / 15% exposure / Trim 15% every +2000% | 30D / 20% OTM / 15% exposure / Trim 25% every +2000% | Trim 15% every +2000% | No filter | No premium filter | $311,432,723 | 311,332.72% | 260.53% | -87.77% | 2021-11-04 -> 2023-01-06 | -73.35% | 9 | 81.82% | 3,548,256 | 2,257,981 | 582 | 2021-11-04 -> 2023-06-09 | 26.96% | -40.39% | 575 | 2021-11-04 -> 2023-06-02 | -68.30% | -41.43% | -47.81% | 29.64 | 19.86% | 1.67% | 51.12 | 4 |
| 30D / 20% OTM / 12.5% exposure / Trim 25% every +3000% | Trim 25% every +3000% | No filter | No premium filter | $284,223,876 | 284,123.88% | 255.31% | -82.41% | 2021-11-04 -> 2023-01-06 | -73.35% | 9 | 81.82% | 3,448,711 | 2,194,634 | 581 | 2021-11-04 -> 2023-06-08 | 6.55% | -42.71% | 455 | 2021-11-04 -> 2023-02-02 | -58.98% | -53.83% | -54.08% | 29.64 | 19.86% | 1.67% | 51.12 | 4 | |
| 30D / 20% OTM / 12.5% exposure / Trim 10% every +1000% | Trim 10% every +1000% | No filter | No premium filter | $278,982,140 | 278,882.14% | 254.26% | -81.04% | 2021-11-04 -> 2023-01-06 | -73.35% | 9 | 81.82% | 3,442,598 | 2,190,744 | 580 | 2021-11-04 -> 2023-06-07 | 2.94% | -45.22% | 455 | 2021-11-04 -> 2023-02-02 | -55.77% | -50.22% | -54.08% | 29.64 | 19.86% | 1.67% | 51.12 | 4 | |
| 30D / 20% OTM / 15% exposure / Trim 10% every +2000% | 30D / 20% OTM / 12.5% exposure / Trim 25% every +2000% | Trim 10% every +2000% | No filter | No premium filter | $302,875,000 | 302,775.00% | 258.93% | -88.72% | 2021-11-04 -> 2023-01-06 | -73.35% | 9 | 81.82% | 3,413,830 | 2,172,437 | 582 | 2021-11-04 -> 2023-06-09 | 18.31% | -40.39% | 575 | 2021-11-04 -> 2023-06-02 | -70.76% | -46.05% | -47.81% | 29.64 | 19.86% | 1.67% | 51.12 | 4 |
| 30D / 20% OTM / 12.5% exposure / Trim 15% every +3000% | 30D / 20% OTM / 12.5% exposure / Trim 25% every +2000% | Trim 15% every +3000% | No filter | No premium filter | $284,414,652 | 284,314.65% | 255.35% | -84.11% | 2021-11-04 -> 2023-01-06 | -73.35% | 9 | 81.82% | 3,381,451 | 2,151,832 | 582 | 2021-11-04 -> 2023-06-09 | 39.31% | -40.39% | 461 | 2021-11-04 -> 2023-02-08 | -62.93% | -50.90% | -50.90% | 29.64 | 19.86% | 1.67% | 51.12 | 4 |
| 30D / 20% OTM / 15% exposure / Trim 10% every +1000% | 30D / 20% OTM / 12.5% exposure / Trim 25% every +2000% | Trim 10% every +1000% | No filter | No premium filter | $289,088,344 | 288,988.34% | 256.28% | -86.57% | 2021-11-04 -> 2023-01-06 | -73.35% | 9 | 81.82% | 3,339,303 | 2,125,011 | 582 | 2021-11-04 -> 2023-06-09 | 35.14% | -40.39% | 462 | 2021-11-04 -> 2023-02-09 | -65.19% | -46.21% | -49.43% | 29.64 | 19.86% | 1.67% | 51.12 | 4 |
| 30D / 20% OTM / 12.5% exposure / Trim 50% every +2000% | Trim 50% every +2000% | No filter | No premium filter | $264,615,044 | 264,515.04% | 251.29% | -79.56% | 2021-01-08 -> 2021-10-14 | -36.15% | 9 | 81.82% | 3,325,934 | 2,116,503 | 435 | 2022-03-29 -> 2023-06-07 | 16.84% | -38.73% | 380 | 2023-06-21 -> 2024-07-05 | -61.18% | 3.22% | -3.06% | 29.64 | 19.86% | 1.67% | 51.12 | 4 | |
| 30D / 20% OTM / 12.5% exposure / Trim 10% every +3000% | 30D / 20% OTM / 12.5% exposure / Trim 25% every +2000% | Trim 10% every +3000% | No filter | No premium filter | $281,135,052 | 281,035.05% | 254.69% | -85.09% | 2021-11-04 -> 2023-01-06 | -73.35% | 9 | 81.82% | 3,304,123 | 2,102,624 | 582 | 2021-11-04 -> 2023-06-09 | 30.75% | -40.39% | 462 | 2021-11-04 -> 2023-02-09 | -65.21% | -47.98% | -49.43% | 29.64 | 19.86% | 1.67% | 51.12 | 4 |
| 30D / 20% OTM / 12.5% exposure | 30D / 20% OTM / 12.5% exposure / Trim 25% every +2000% | Hold to expiry | No filter | No premium filter | $265,742,054 | 265,642.05% | 251.52% | -87.29% | 2021-11-04 -> 2023-01-06 | -73.35% | 9 | 81.82% | 3,044,435 | 1,937,368 | 582 | 2021-11-04 -> 2023-06-09 | 11.42% | -40.39% | 575 | 2021-11-04 -> 2023-06-02 | -70.35% | -47.73% | -47.81% | 29.64 | 19.86% | 1.67% | 51.12 | 4 |
| 30D / 20% OTM / 15% exposure | 30D / 20% OTM / 12.5% exposure / Trim 25% every +2000% | Hold to expiry | No filter | No premium filter | $266,296,725 | 266,196.72% | 251.64% | -91.12% | 2021-11-04 -> 2023-01-06 | -73.35% | 9 | 81.82% | 2,922,342 | 1,859,672 | 586 | 2021-11-04 -> 2023-06-13 | 10.44% | -36.90% | 580 | 2021-11-04 -> 2023-06-07 | -76.99% | -41.78% | -45.22% | 29.64 | 19.86% | 1.67% | 51.12 | 4 |
| 60D / 30% OTM / 15% exposure | 30D / 20% OTM / 12.5% exposure / Trim 25% every +2000% | Hold to expiry | No filter | No premium filter | $210,646,972 | 210,546.97% | 238.74% | -86.92% | 2021-11-04 -> 2023-01-06 | -73.35% | 9 | 81.82% | 2,423,523 | 1,542,242 | 1,133 | 2021-11-04 -> 2024-12-11 | 2.24% | 3.61% | 586 | 2021-11-04 -> 2023-06-13 | -72.96% | -30.84% | -36.90% | 58.65 | 28.89% | 2.33% | 52.53 | 10 |
| 30D / 20% OTM / 10% exposure | 30D / 20% OTM / 12.5% exposure / Trim 25% every +2000% | Hold to expiry | No filter | No premium filter | $197,796,346 | 197,696.35% | 235.36% | -82.02% | 2021-11-04 -> 2023-01-06 | -73.35% | 9 | 81.82% | 2,411,630 | 1,534,674 | 582 | 2021-11-04 -> 2023-06-09 | 23.79% | -40.39% | 462 | 2021-11-04 -> 2023-02-09 | -62.16% | -47.11% | -49.43% | 29.64 | 19.86% | 1.67% | 51.12 | 4 |
| 30D / 20% OTM / 7.5% exposure | 30D / 20% OTM / 10% exposure / Trim 25% every +2000% | Hold to expiry | No filter | No premium filter | $100,873,268 | 100,773.27% | 201.22% | -74.76% | 2021-11-04 -> 2023-01-06 | -73.35% | 9 | 81.82% | 1,349,378 | 858,695 | 582 | 2021-11-04 -> 2023-06-09 | 28.88% | -40.39% | 593 | 2020-03-18 -> 2021-11-01 | -76.69% | 1,704.46% | 1,572.69% | 29.64 | 19.86% | 1.67% | 51.12 | 4 |
| 30D / 20% OTM / 12.5% exposure / Trim 15% every +1000% | Trim 15% every +1000% | No filter | No premium filter | $261,460,960 | 261,360.96% | 250.62% | -79.56% | 2021-01-08 -> 2021-10-14 | -36.15% | 9 | 81.82% | 3,286,351 | 2,091,314 | 580 | 2021-11-04 -> 2023-06-07 | 12.19% | -45.22% | 380 | 2023-06-21 -> 2024-07-05 | -60.75% | 2.15% | -3.06% | 29.64 | 19.86% | 1.67% | 51.12 | 4 | |
| 30D / 20% OTM / 12.5% exposure / Trim 50% every +3000% | 30D / 20% OTM / 12.5% exposure / Trim 50% every +2000% | Trim 50% every +3000% | No filter | No premium filter | $257,833,122 | 257,733.12% | 249.84% | -79.57% | 2021-11-04 -> 2023-01-06 | -73.35% | 9 | 81.82% | 3,240,374 | 2,062,056 | 580 | 2021-11-04 -> 2023-06-07 | 12.80% | -45.22% | 380 | 2023-06-21 -> 2024-07-05 | -62.03% | 0.96% | -3.06% | 29.64 | 19.86% | 1.67% | 51.12 | 4 |
| 30D / 20% OTM / 12.5% exposure / Trim 25% every +1000% | 30D / 20% OTM / 10% exposure / Trim 15% every +2000% | Trim 25% every +1000% | No filter | No premium filter | $215,241,017 | 215,141.02% | 239.91% | -79.56% | 2021-01-08 -> 2021-10-14 | -36.15% | 9 | 81.82% | 2,705,355 | 1,721,590 | 433 | 2022-03-29 -> 2023-06-05 | 3.88% | -40.63% | 380 | 2023-06-21 -> 2024-07-05 | -60.00% | 2.59% | -3.06% | 29.64 | 19.86% | 1.67% | 51.12 | 4 |
| 30D / 20% OTM / 15% exposure / Trim 25% every +3000% | 30D / 20% OTM / 12.5% exposure / Trim 25% every +2000% | Trim 25% every +3000% | No filter | No premium filter | $286,383,694 | 286,283.69% | 255.74% | -87.63% | 2021-11-04 -> 2023-01-06 | -73.35% | 9 | 81.82% | 3,267,966 | 2,079,614 | 582 | 2021-11-04 -> 2023-06-09 | 32.34% | -40.39% | 575 | 2021-11-04 -> 2023-06-02 | -67.94% | -41.00% | -47.81% | 29.64 | 19.86% | 1.67% | 51.12 | 4 |
| 30D / 20% OTM / 15% exposure / Trim 15% every +3000% | 30D / 20% OTM / 12.5% exposure / Trim 25% every +2000% | Trim 15% every +3000% | No filter | No premium filter | $285,936,421 | 285,836.42% | 255.65% | -88.85% | 2021-11-04 -> 2023-01-06 | -73.35% | 9 | 81.82% | 3,218,329 | 2,048,028 | 582 | 2021-11-04 -> 2023-06-09 | 19.37% | -40.39% | 575 | 2021-11-04 -> 2023-06-02 | -71.09% | -46.78% | -47.81% | 29.64 | 19.86% | 1.67% | 51.12 | 4 |
| 30D / 20% OTM / 15% exposure / Trim 15% every +1000% | 30D / 20% OTM / 12.5% exposure / Trim 25% every +2000% | Trim 15% every +1000% | No filter | No premium filter | $273,812,368 | 273,712.37% | 253.21% | -85.31% | 2021-01-08 -> 2021-10-14 | -36.15% | 9 | 81.82% | 3,209,636 | 2,042,495 | 581 | 2021-11-04 -> 2023-06-08 | 3.59% | -42.71% | 385 | 2023-06-21 -> 2024-07-10 | -70.29% | 3.98% | 1.46% | 29.64 | 19.86% | 1.67% | 51.12 | 4 |
| 60D / 30% OTM / 15% exposure / Trim 25% every +3000% | 30D / 20% OTM / 12.5% exposure / Trim 25% every +2000% | Trim 25% every +3000% | No filter | No premium filter | $215,665,527 | 215,565.53% | 240.02% | -82.67% | 2021-11-04 -> 2023-01-06 | -73.35% | 9 | 81.82% | 2,608,728 | 1,660,100 | 593 | 2021-11-04 -> 2023-06-20 | 4.35% | -33.06% | 582 | 2021-11-04 -> 2023-06-09 | -64.18% | -24.84% | -40.39% | 58.65 | 28.89% | 2.33% | 52.53 | 10 |
| 60D / 30% OTM / 15% exposure / Trim 15% every +3000% | 30D / 20% OTM / 12.5% exposure / Trim 25% every +2000% | Trim 15% every +3000% | No filter | No premium filter | $216,976,181 | 216,876.18% | 240.34% | -84.29% | 2021-11-04 -> 2023-01-06 | -73.35% | 9 | 81.82% | 2,574,035 | 1,638,022 | 621 | 2021-11-04 -> 2023-07-18 | 1.25% | -28.45% | 582 | 2021-11-04 -> 2023-06-09 | -67.54% | -31.88% | -40.39% | 58.65 | 28.89% | 2.33% | 52.53 | 10 |
| 60D / 30% OTM / 15% exposure / Trim 50% every +3000% | 30D / 20% OTM / 10% exposure / Trim 15% every +2000% | Trim 50% every +3000% | No filter | No premium filter | $201,371,263 | 201,271.26% | 236.32% | -78.92% | 2021-11-04 -> 2023-01-06 | -73.35% | 9 | 81.82% | 2,551,436 | 1,623,641 | 586 | 2021-11-04 -> 2023-06-13 | 5.99% | -36.90% | 581 | 2021-11-04 -> 2023-06-08 | -56.44% | -39.94% | -42.71% | 58.65 | 28.89% | 2.33% | 52.53 | 10 |
| 30D / 20% OTM / 10% exposure / Trim 25% every +2000% | Trim 25% every +2000% | No filter | No premium filter | $221,226,079 | 221,126.08% | 241.40% | -72.89% | 2021-11-04 -> 2023-01-06 | -73.35% | 9 | 81.82% | 3,034,864 | 1,931,277 | 578 | 2021-11-04 -> 2023-06-05 | 3.76% | -46.92% | 323 | 2020-12-09 -> 2021-10-28 | -73.53% | 79.06% | 78.17% | 29.64 | 19.86% | 1.67% | 51.12 | 4 | |
| 30D / 20% OTM / 10% exposure / Trim 15% every +2000% | Trim 15% every +2000% | No filter | No premium filter | $222,858,543 | 222,758.54% | 241.80% | -75.64% | 2021-11-04 -> 2023-01-06 | -73.35% | 9 | 81.82% | 2,946,171 | 1,874,836 | 580 | 2021-11-04 -> 2023-06-07 | 9.67% | -45.22% | 449 | 2021-11-04 -> 2023-01-27 | -48.75% | -56.16% | -56.61% | 29.64 | 19.86% | 1.67% | 51.12 | 4 | |
| 30D / 20% OTM / 10% exposure / Trim 10% every +2000% | 30D / 20% OTM / 10% exposure / Trim 15% every +2000% | Trim 10% every +2000% | No filter | No premium filter | $219,184,994 | 219,084.99% | 240.89% | -77.45% | 2021-11-04 -> 2023-01-06 | -73.35% | 9 | 81.82% | 2,830,001 | 1,800,910 | 580 | 2021-11-04 -> 2023-06-07 | 1.43% | -45.22% | 452 | 2021-11-04 -> 2023-01-30 | -52.55% | -57.97% | -59.35% | 29.64 | 19.86% | 1.67% | 51.12 | 4 |
| 30D / 20% OTM / 7.5% exposure / Trim 25% every +2000% | Trim 25% every +2000% | No filter | No premium filter | $110,098,079 | 109,998.08% | 205.45% | -62.64% | 2021-11-04 -> 2023-01-06 | -73.35% | 9 | 81.82% | 1,757,715 | 1,118,546 | 575 | 2021-11-04 -> 2023-06-02 | 4.29% | -47.81% | 601 | 2020-03-18 -> 2021-11-09 | -75.80% | 1,332.72% | 1,316.53% | 29.64 | 19.86% | 1.67% | 51.12 | 4 | |
| 30D / 20% OTM / 7.5% exposure / Trim 15% every +2000% | Trim 15% every +2000% | No filter | No premium filter | $111,464,213 | 111,364.21% | 206.05% | -66.29% | 2021-11-04 -> 2023-01-06 | -73.35% | 9 | 81.82% | 1,681,581 | 1,070,097 | 578 | 2021-11-04 -> 2023-06-05 | 2.36% | -46.92% | 595 | 2020-03-18 -> 2021-11-03 | -76.16% | 1,633.91% | 1,579.99% | 29.64 | 19.86% | 1.67% | 51.12 | 4 | |
| 30D / 20% OTM / 7.5% exposure / Trim 25% every +3000% | 30D / 20% OTM / 7.5% exposure / Trim 25% every +2000% | Trim 25% every +3000% | No filter | No premium filter | $106,395,355 | 106,295.36% | 203.79% | -65.87% | 2021-11-04 -> 2023-01-06 | -73.35% | 9 | 81.82% | 1,615,194 | 1,027,851 | 578 | 2021-11-04 -> 2023-06-05 | 3.33% | -46.92% | 595 | 2020-03-18 -> 2021-11-03 | -76.70% | 1,590.95% | 1,579.99% | 29.64 | 19.86% | 1.67% | 51.12 | 4 |
| TSLA buy & hold | Benchmark | Benchmark | Benchmark | $1,220,188 | 1,120.19% | 49.01% | -73.63% | 2021-11-04 -> 2023-01-03 | -73.63% | — | — | 16,572 | 16,572 | 1,133 | 2021-11-04 -> 2024-12-11 | 3.61% | 3.61% | 0 | 2019-01-02 -> 2019-01-02 | 0.00% | 0.00% | 0.00% | — | — | — | — | — |
Top Stage 3 NAV Curves
Stage 3 Winner One-Year Fresh Starts
| Strategy | Window | Window type | Call return | TSLA return | Excess vs TSLA | Beat TSLA | Call max DD | TSLA max DD | Trades |
|---|---|---|---|---|---|---|---|---|---|
| 30D / 20% OTM / 12.5% exposure / Trim 25% every +2000% | 2019 | calendar_year | 253.34% | 34.89% | 218.45% | yes | -74.33% | -48.46% | 52 |
| TSLA buy & hold | 2019 | calendar_year | 34.89% | 34.89% | 0.00% | — | -48.46% | -48.46% | — |
| 30D / 20% OTM / 12.5% exposure / Trim 25% every +2000% | 2019 Jul-Jun | jul_to_jun | 7,470.18% | 375.28% | 7,094.91% | yes | -44.62% | -60.62% | 53 |
| TSLA buy & hold | 2019 Jul-Jun | jul_to_jun | 375.28% | 375.28% | 0.00% | — | -60.62% | -60.62% | — |
| 30D / 20% OTM / 12.5% exposure / Trim 25% every +2000% | 2020 | calendar_year | 4,060.11% | 720.00% | 3,340.12% | yes | -55.62% | -60.62% | 52 |
| TSLA buy & hold | 2020 | calendar_year | 720.00% | 720.00% | 0.00% | — | -60.62% | -60.62% | — |
| 30D / 20% OTM / 12.5% exposure / Trim 25% every +2000% | 2020 Jul-Jun | jul_to_jun | 125.31% | 203.43% | -78.11% | no | -65.30% | -36.24% | 52 |
| TSLA buy & hold | 2020 Jul-Jun | jul_to_jun | 203.43% | 203.43% | 0.00% | — | -36.24% | -36.24% | — |
| 30D / 20% OTM / 12.5% exposure / Trim 25% every +2000% | 2021 | calendar_year | 98.37% | 29.45% | 68.92% | yes | -69.64% | -36.19% | 51 |
| TSLA buy & hold | 2021 | calendar_year | 29.45% | 29.45% | 0.00% | — | -36.19% | -36.19% | — |
| 30D / 20% OTM / 12.5% exposure / Trim 25% every +2000% | 2021 Jul-Jun | jul_to_jun | 140.68% | -0.66% | 141.34% | yes | -63.03% | -48.89% | 52 |
| TSLA buy & hold | 2021 Jul-Jun | jul_to_jun | -0.66% | -0.66% | 0.00% | — | -48.89% | -48.89% | — |
| 30D / 20% OTM / 12.5% exposure / Trim 25% every +2000% | 2022 | calendar_year | -61.43% | -69.19% | 7.75% | yes | -74.68% | -72.71% | 52 |
| TSLA buy & hold | 2022 | calendar_year | -69.19% | -69.19% | 0.00% | — | -72.71% | -72.71% | — |
| 30D / 20% OTM / 12.5% exposure / Trim 25% every +2000% | 2022 Jul-Jun | jul_to_jun | 498.50% | 15.18% | 483.32% | yes | -62.57% | -65.05% | 52 |
| TSLA buy & hold | 2022 Jul-Jun | jul_to_jun | 15.18% | 15.18% | 0.00% | — | -65.05% | -65.05% | — |
| 30D / 20% OTM / 12.5% exposure / Trim 25% every +2000% | 2023 | calendar_year | 382.29% | 129.85% | 252.44% | yes | -46.86% | -32.72% | 52 |
| TSLA buy & hold | 2023 | calendar_year | 129.85% | 129.85% | 0.00% | — | -32.72% | -32.72% | — |
| 30D / 20% OTM / 12.5% exposure / Trim 25% every +2000% | 2023 Jul-Jun | jul_to_jun | -75.28% | -29.25% | -46.03% | no | -78.63% | -51.52% | 52 |
| TSLA buy & hold | 2023 Jul-Jun | jul_to_jun | -29.25% | -29.25% | 0.00% | — | -51.52% | -51.52% | — |
| 30D / 20% OTM / 12.5% exposure / Trim 25% every +2000% | 2024 | calendar_year | 330.96% | 67.93% | 263.03% | yes | -53.48% | -42.76% | 52 |
| TSLA buy & hold | 2024 | calendar_year | 67.93% | 67.93% | 0.00% | — | -42.76% | -42.76% | — |
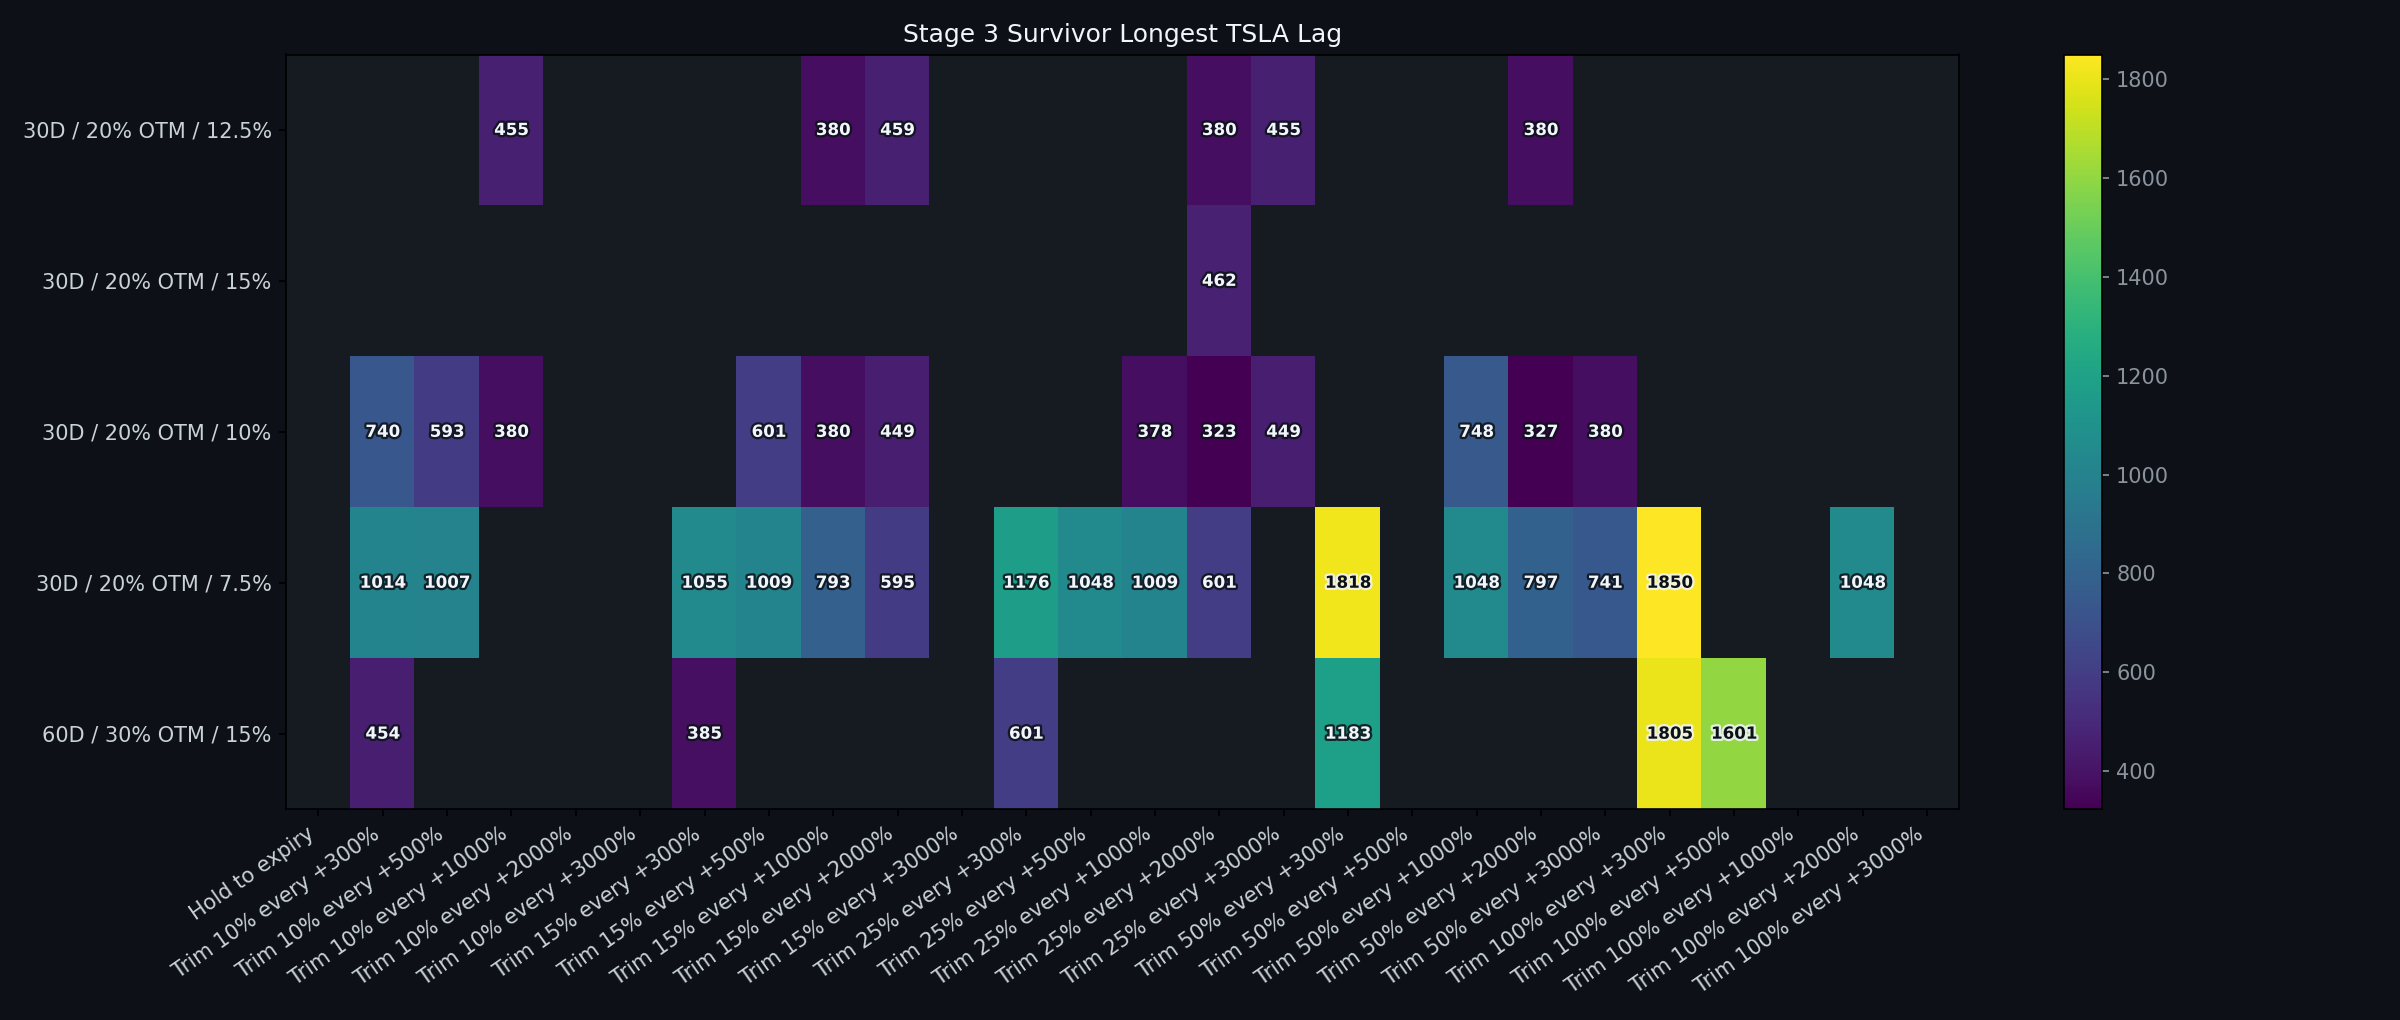
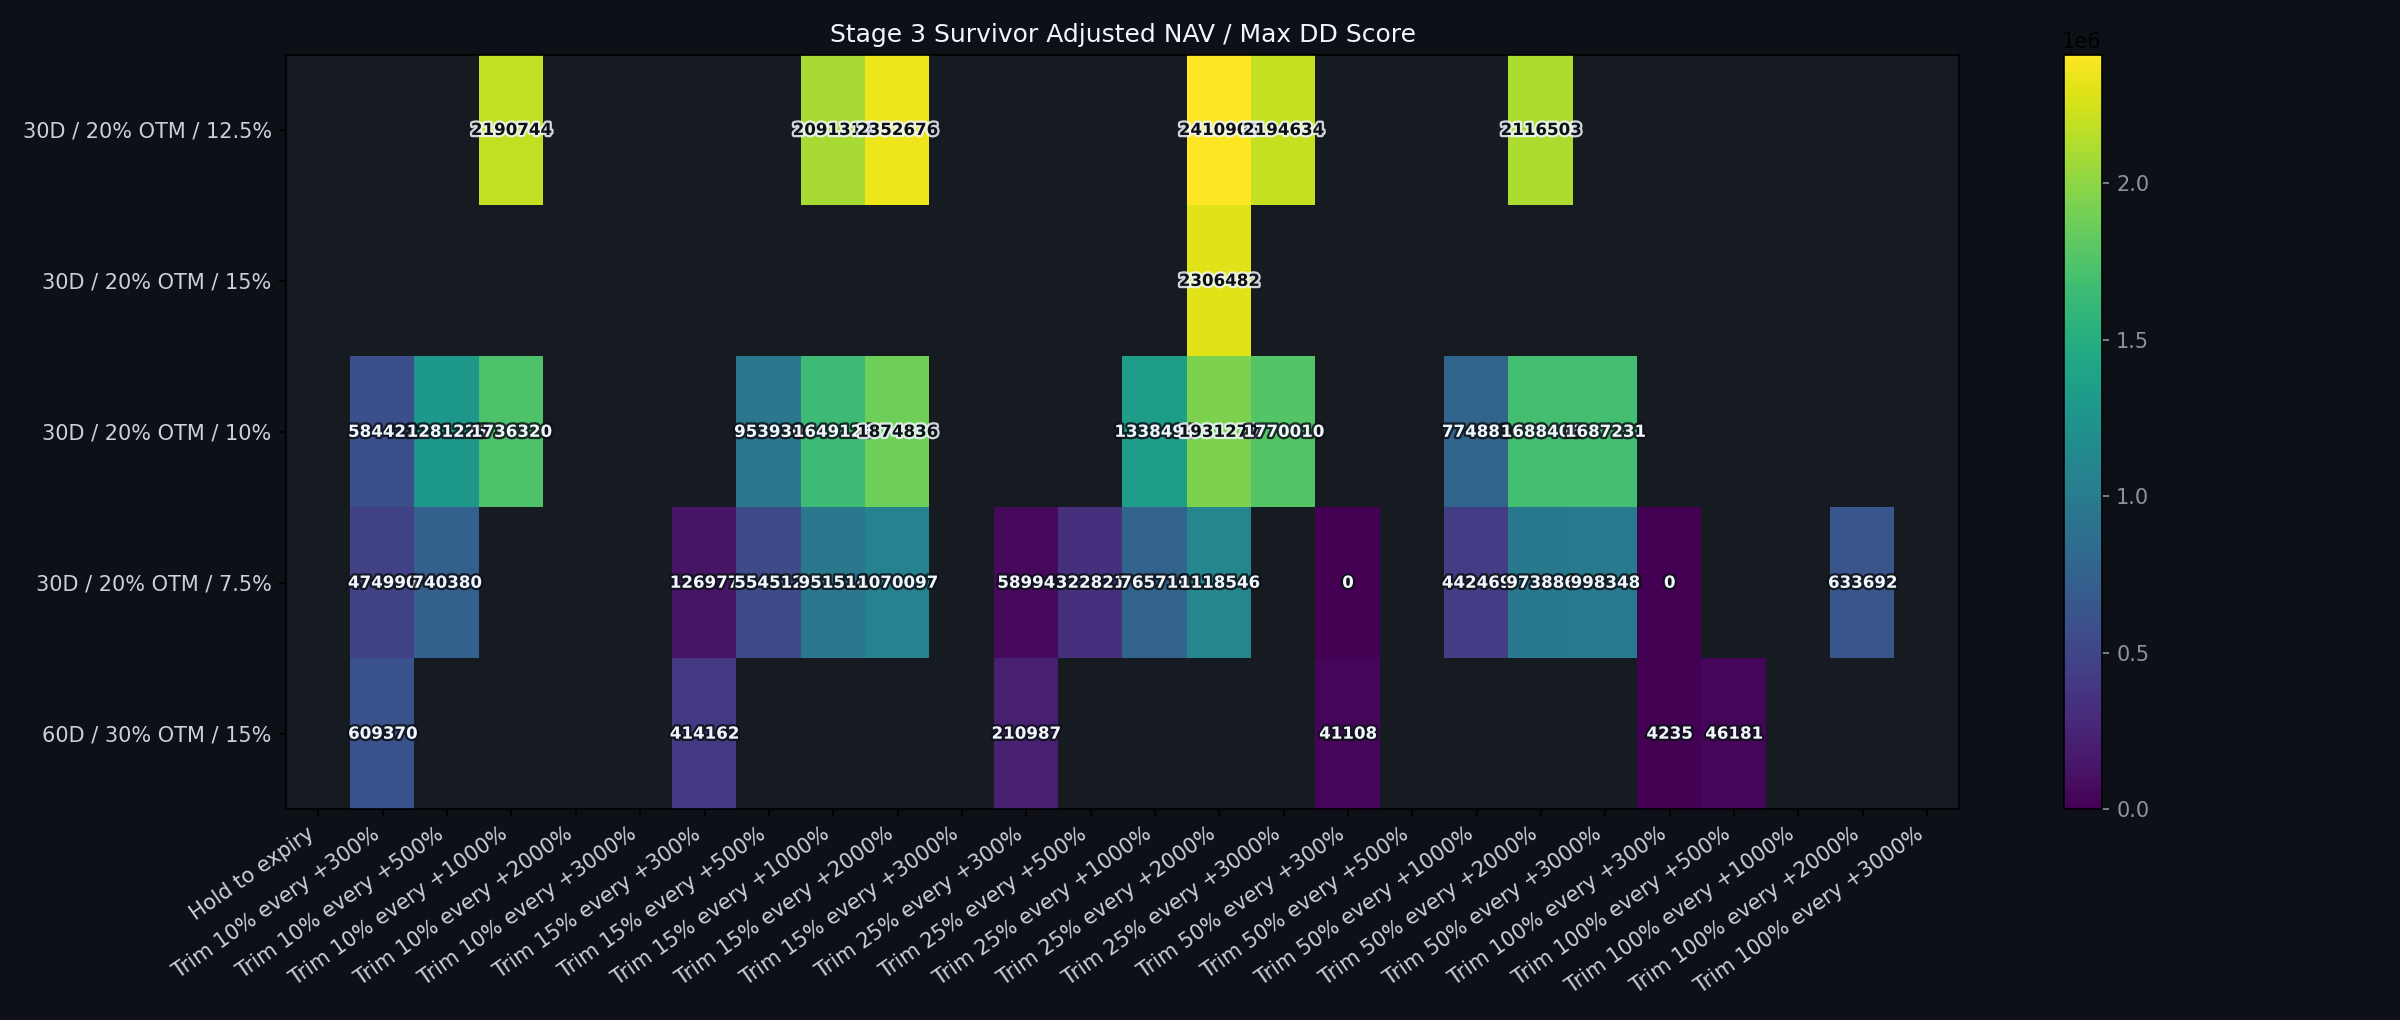
Stage 3 Heatmaps
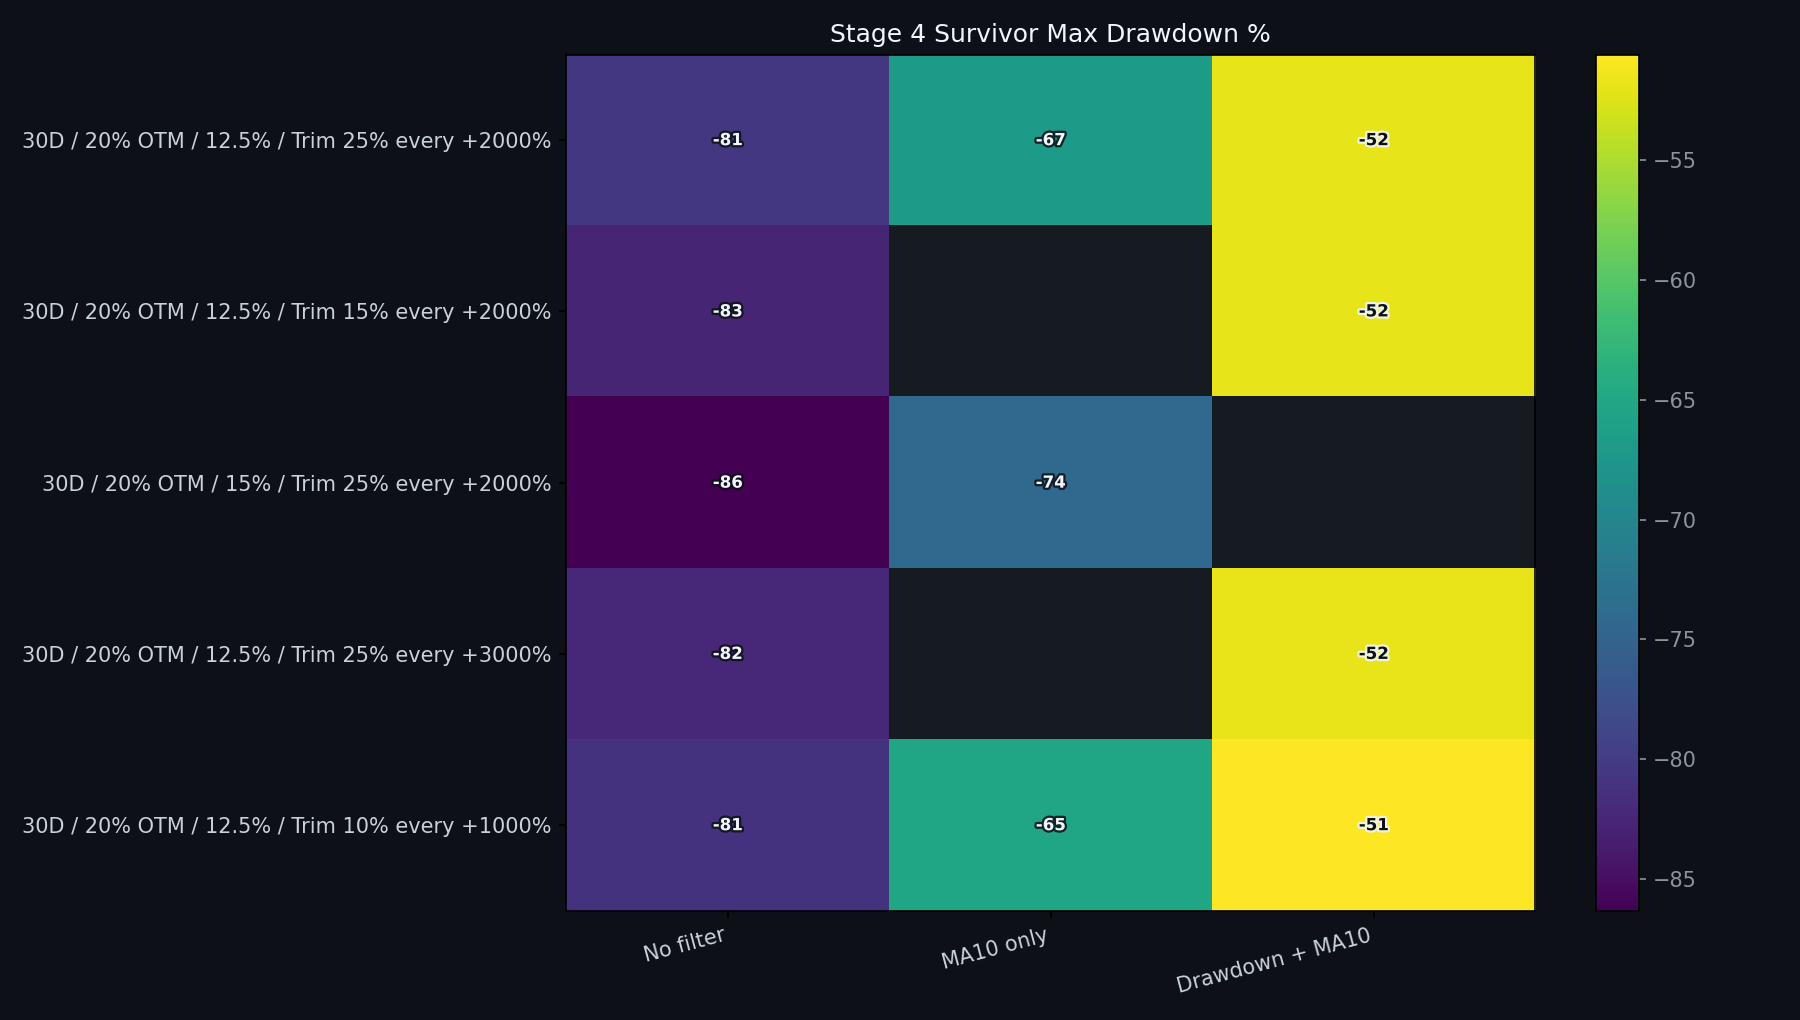
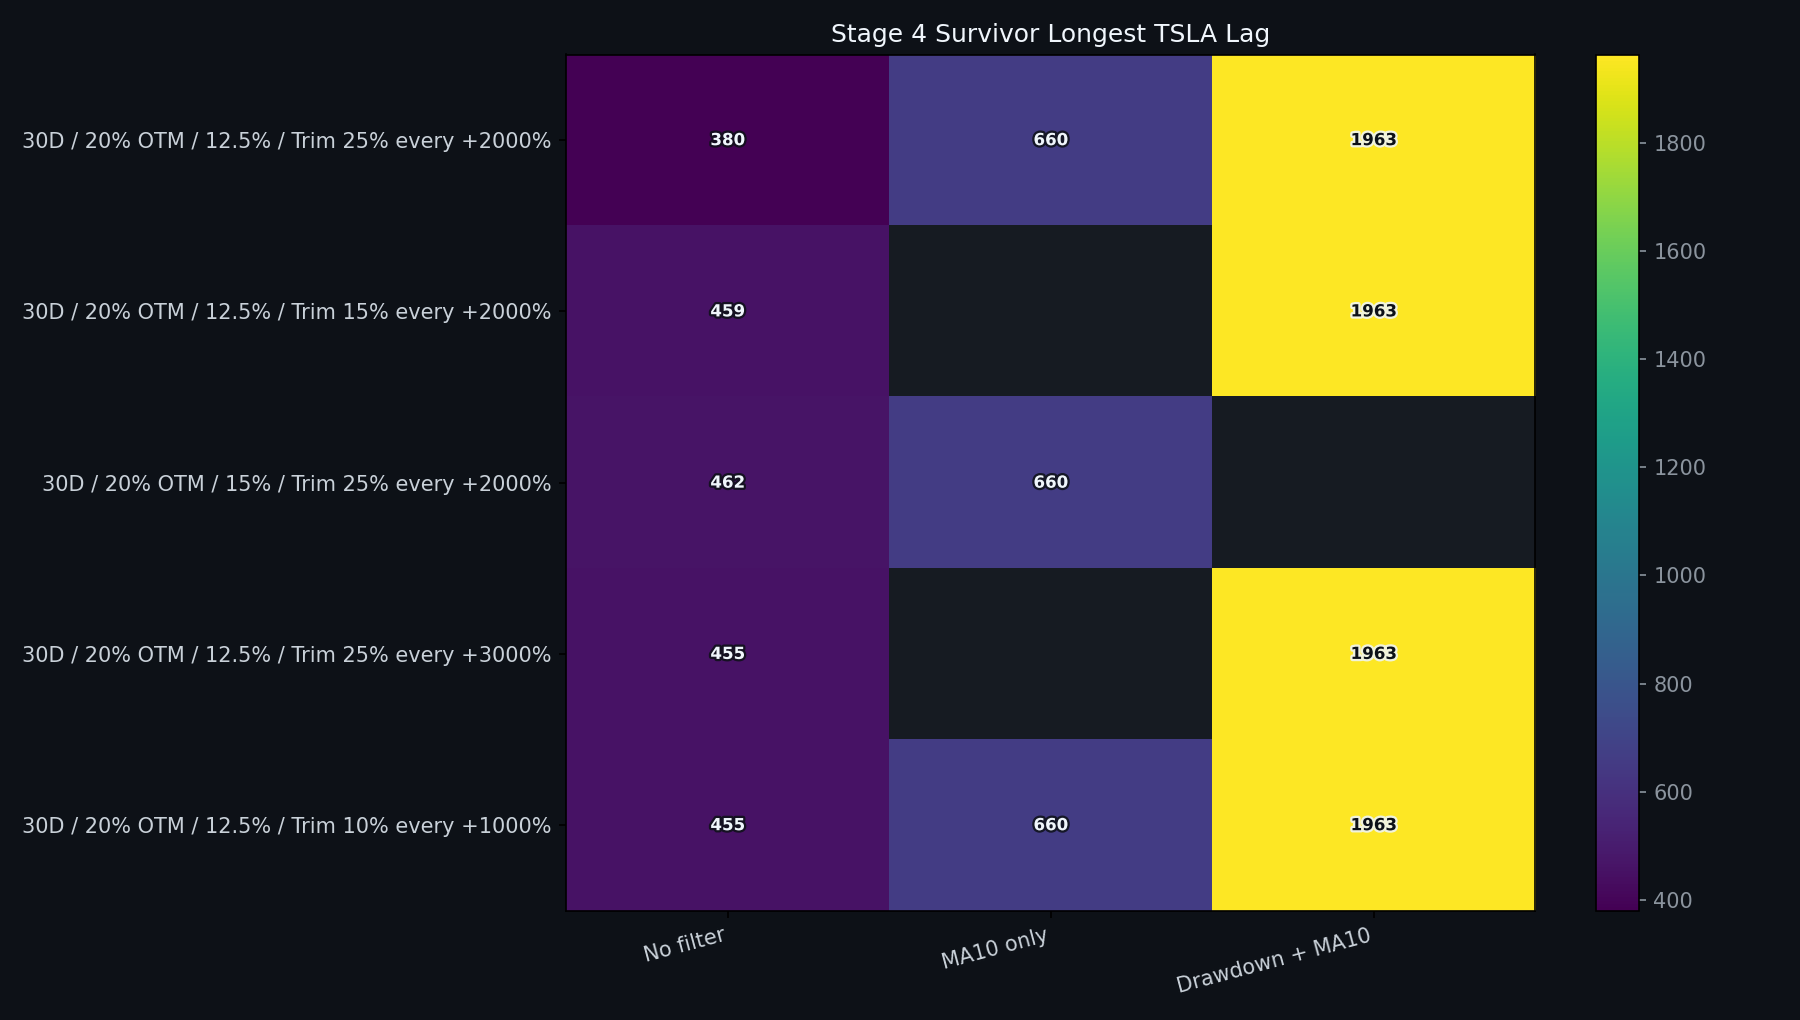
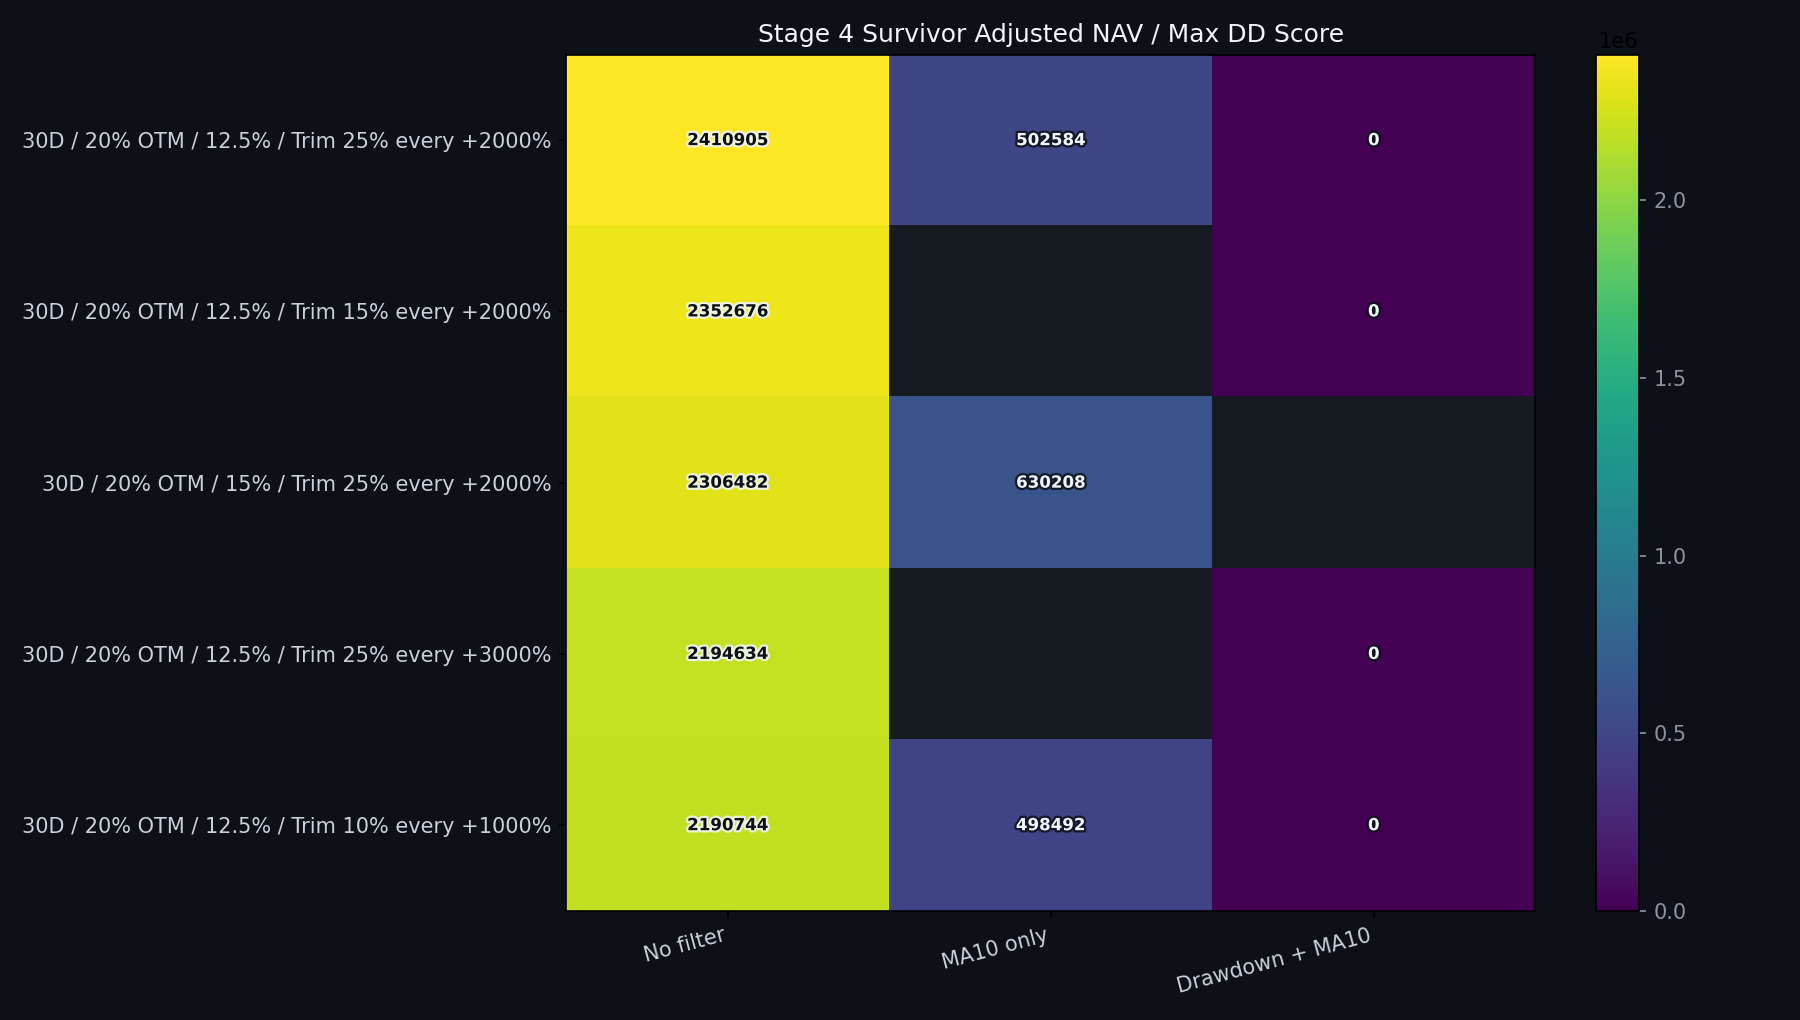
Stage 4: MA10 Trend Filter
Stage 4 takes the top 5 non-dominated Stage 3 candidates by beat-rate adjusted NAV/max-DD score plus the top 3 by final NAV, de-duplicated, and tests three purchase rules: no filter, buy only when TSLA close is above MA10, and drawdown + MA10. The filter only blocks new weekly buys; open option lots keep their expiry and take-profit rules.
Stage 4 Carry-Forward Parents
| Parent strategy | Selected by | Score rank | Final NAV rank | Final NAV | Max DD | Drawdown period | Tesla drawdown in that window | Beat rate | Base NAV/DD | Beat-rate adjusted NAV / max DD score | Longest negative period | Longest TSLA lag | Worst lag vs TSLA |
|---|---|---|---|---|---|---|---|---|---|---|---|---|---|
| 30D / 20% OTM / 12.5% exposure / Trim 25% every +2000% | score + final NAV | 1 | 3 | $305,346,193 | -80.60% | 2021-11-04 -> 2023-01-06 | -73.35% | 81.82% | 3,788,565 | 2,410,905 | 580 | 380 | -61.55% |
| 30D / 20% OTM / 12.5% exposure / Trim 15% every +2000% | score + final NAV | 2 | 2 | $305,437,456 | -82.62% | 2021-11-04 -> 2023-01-06 | -73.35% | 81.82% | 3,697,062 | 2,352,676 | 581 | 459 | -59.45% |
| 30D / 20% OTM / 15% exposure / Trim 25% every +2000% | score + final NAV | 3 | 1 | $312,877,165 | -86.32% | 2021-11-04 -> 2023-01-06 | -73.35% | 81.82% | 3,624,471 | 2,306,482 | 582 | 462 | -64.55% |
| 30D / 20% OTM / 12.5% exposure / Trim 25% every +3000% | score | 4 | — | $284,223,876 | -82.41% | 2021-11-04 -> 2023-01-06 | -73.35% | 81.82% | 3,448,711 | 2,194,634 | 581 | 455 | -58.98% |
| 30D / 20% OTM / 12.5% exposure / Trim 10% every +1000% | score | 5 | — | $278,982,140 | -81.04% | 2021-11-04 -> 2023-01-06 | -73.35% | 81.82% | 3,442,598 | 2,190,744 | 580 | 455 | -55.77% |
| TSLA buy & hold | — | — | — | $1,220,188 | -73.63% | 2021-11-04 -> 2023-01-03 | -73.63% | — | 16,572 | 16,572 | 1,133 | 0 | 0.00% |
Top Stage 4 Candidates
| Strategy | Dominated by | Take profit | Trend filter | Premium filter | Final NAV | Total return | CAGR | Max DD | Drawdown period | Tesla drawdown in that window | Year wins | Beat rate | Base NAV/DD | Beat-rate adjusted NAV / max DD score | Longest negative period | Negative period | Call return in negative period | TSLA return in negative period | Longest TSLA lag | TSLA lag period | Worst lag vs TSLA | Call return in TSLA lag | TSLA return in TSLA lag | Avg DTE | Avg moneyness | Avg prem/spot | Avg prem pctile | Skipped |
|---|---|---|---|---|---|---|---|---|---|---|---|---|---|---|---|---|---|---|---|---|---|---|---|---|---|---|---|---|
| 30D / 20% OTM / 12.5% exposure / Trim 25% every +2000% | Trim 25% every +2000% | No filter | No premium filter | $305,346,193 | 305,246.19% | 259.40% | -80.60% | 2021-11-04 -> 2023-01-06 | -73.35% | 9 | 81.82% | 3,788,565 | 2,410,905 | 580 | 2021-11-04 -> 2023-06-07 | 7.75% | -45.22% | 380 | 2023-06-21 -> 2024-07-05 | -61.55% | 2.23% | -3.06% | 29.64 | 19.86% | 1.67% | 51.12 | 4 | |
| 30D / 20% OTM / 12.5% exposure / Trim 15% every +2000% | Trim 15% every +2000% | No filter | No premium filter | $305,437,456 | 305,337.46% | 259.41% | -82.62% | 2021-11-04 -> 2023-01-06 | -73.35% | 9 | 81.82% | 3,697,062 | 2,352,676 | 581 | 2021-11-04 -> 2023-06-08 | 5.69% | -42.71% | 459 | 2021-11-04 -> 2023-02-06 | -59.45% | -49.18% | -52.49% | 29.64 | 19.86% | 1.67% | 51.12 | 4 | |
| 30D / 20% OTM / 15% exposure / Trim 25% every +2000% | Trim 25% every +2000% | No filter | No premium filter | $312,877,165 | 312,777.16% | 260.80% | -86.32% | 2021-11-04 -> 2023-01-06 | -73.35% | 9 | 81.82% | 3,624,471 | 2,306,482 | 582 | 2021-11-04 -> 2023-06-09 | 39.00% | -40.39% | 462 | 2021-11-04 -> 2023-02-09 | -64.55% | -44.47% | -49.43% | 29.64 | 19.86% | 1.67% | 51.12 | 4 | |
| 30D / 20% OTM / 12.5% exposure / Trim 25% every +3000% | Trim 25% every +3000% | No filter | No premium filter | $284,223,876 | 284,123.88% | 255.31% | -82.41% | 2021-11-04 -> 2023-01-06 | -73.35% | 9 | 81.82% | 3,448,711 | 2,194,634 | 581 | 2021-11-04 -> 2023-06-08 | 6.55% | -42.71% | 455 | 2021-11-04 -> 2023-02-02 | -58.98% | -53.83% | -54.08% | 29.64 | 19.86% | 1.67% | 51.12 | 4 | |
| 30D / 20% OTM / 12.5% exposure / Trim 10% every +1000% | Trim 10% every +1000% | No filter | No premium filter | $278,982,140 | 278,882.14% | 254.26% | -81.04% | 2021-11-04 -> 2023-01-06 | -73.35% | 9 | 81.82% | 3,442,598 | 2,190,744 | 580 | 2021-11-04 -> 2023-06-07 | 2.94% | -45.22% | 455 | 2021-11-04 -> 2023-02-02 | -55.77% | -50.22% | -54.08% | 29.64 | 19.86% | 1.67% | 51.12 | 4 | |
| 30D / 20% OTM / 15% exposure / Trim 25% every +2000% / MA10 only | Trim 25% every +2000% | MA10 only | No premium filter | $102,746,845 | 102,646.85% | 202.11% | -74.11% | 2023-06-20 -> 2024-11-04 | -51.53% | 8 | 72.73% | 1,386,457 | 630,208 | 661 | 2023-06-20 -> 2025-04-11 | -63.40% | -8.07% | 660 | 2023-06-21 -> 2025-04-11 | -76.64% | -62.99% | -2.76% | 29.69 | 19.76% | 1.68% | 51.46 | 149 | |
| 30D / 20% OTM / 12.5% exposure / Trim 25% every +2000% / MA10 only | Trim 25% every +2000% | MA10 only | No premium filter | $73,896,393 | 73,796.39% | 186.64% | -66.83% | 2023-06-20 -> 2024-11-04 | -51.53% | 8 | 72.73% | 1,105,684 | 502,584 | 661 | 2023-06-20 -> 2025-04-11 | -54.91% | -8.07% | 660 | 2023-06-21 -> 2025-04-11 | -71.46% | -54.46% | -2.76% | 29.69 | 19.76% | 1.68% | 51.46 | 149 | |
| 30D / 20% OTM / 12.5% exposure / Trim 10% every +1000% / MA10 only | Trim 10% every +1000% | MA10 only | No premium filter | $71,403,611 | 71,303.61% | 185.08% | -65.11% | 2023-06-20 -> 2024-11-04 | -51.53% | 8 | 72.73% | 1,096,683 | 498,492 | 546 | 2023-06-20 -> 2024-12-17 | 5.63% | 74.84% | 660 | 2023-06-21 -> 2025-04-11 | -67.82% | -48.64% | -2.76% | 29.69 | 19.76% | 1.68% | 51.46 | 149 | |
| 30D / 20% OTM / 12.5% exposure / Trim 15% every +2000% / MA10 only | 30D / 20% OTM / 12.5% exposure / Trim 25% every +2000% / MA10 only | Trim 15% every +2000% | MA10 only | No premium filter | $72,848,579 | 72,748.58% | 185.99% | -66.94% | 2023-06-20 -> 2024-11-04 | -51.53% | 8 | 72.73% | 1,088,299 | 494,682 | 661 | 2023-06-20 -> 2025-04-11 | -55.05% | -8.07% | 660 | 2023-06-21 -> 2025-04-11 | -71.55% | -54.60% | -2.76% | 29.69 | 19.76% | 1.68% | 51.46 | 149 |
| 30D / 20% OTM / 12.5% exposure / Trim 25% every +3000% / MA10 only | 30D / 20% OTM / 12.5% exposure / Trim 25% every +2000% / MA10 only | Trim 25% every +3000% | MA10 only | No premium filter | $68,630,714 | 68,530.71% | 183.28% | -67.16% | 2023-06-20 -> 2024-11-04 | -51.53% | 8 | 72.73% | 1,021,842 | 464,474 | 661 | 2023-06-20 -> 2025-04-11 | -55.36% | -8.07% | 660 | 2023-06-21 -> 2025-04-11 | -71.74% | -54.90% | -2.76% | 29.69 | 19.76% | 1.68% | 51.46 | 149 |
| 30D / 20% OTM / 12.5% exposure / Trim 25% every +3000% / Drawdown + MA10 | Trim 25% every +3000% | Drawdown + MA10 | No premium filter | $727,840 | 627.84% | 37.22% | -51.83% | 2024-07-10 -> 2024-09-13 | -27.10% | 5 | 45.45% | 14,043 | 0 | 663 | 2021-04-14 -> 2023-02-06 | 11.05% | -20.21% | 1,963 | 2019-11-26 -> 2025-04-11 | -95.59% | 327.80% | 1,050.46% | 30.05 | 19.85% | 1.34% | 45.50 | 246 | |
| 30D / 20% OTM / 12.5% exposure / Trim 15% every +2000% / Drawdown + MA10 | Trim 15% every +2000% | Drawdown + MA10 | No premium filter | $711,276 | 611.28% | 36.72% | -51.87% | 2024-07-10 -> 2024-09-13 | -27.10% | 5 | 45.45% | 13,714 | 0 | 663 | 2021-04-14 -> 2023-02-06 | 11.83% | -20.21% | 1,963 | 2019-11-26 -> 2025-04-11 | -95.57% | 321.11% | 1,050.46% | 30.05 | 19.85% | 1.34% | 45.50 | 246 | |
| 30D / 20% OTM / 12.5% exposure / Trim 25% every +2000% / Drawdown + MA10 | Trim 25% every +2000% | Drawdown + MA10 | No premium filter | $686,539 | 586.54% | 35.95% | -51.92% | 2024-07-10 -> 2024-09-13 | -27.10% | 5 | 45.45% | 13,223 | 0 | 663 | 2021-04-14 -> 2023-02-06 | 12.16% | -20.21% | 1,963 | 2019-11-26 -> 2025-04-11 | -95.57% | 308.39% | 1,050.46% | 30.05 | 19.85% | 1.34% | 45.50 | 246 | |
| 30D / 20% OTM / 15% exposure / Trim 25% every +2000% / Drawdown + MA10 | 30D / 20% OTM / 12.5% exposure / Trim 25% every +3000% / Drawdown + MA10 | Trim 25% every +2000% | Drawdown + MA10 | No premium filter | $704,965 | 604.96% | 36.53% | -57.33% | 2021-04-14 -> 2023-01-19 | -73.56% | 5 | 45.45% | 12,297 | 0 | 663 | 2021-04-14 -> 2023-02-06 | 5.17% | -20.21% | 1,963 | 2019-11-26 -> 2025-04-11 | -95.79% | 313.88% | 1,050.46% | 30.05 | 19.85% | 1.34% | 45.50 | 246 |
| 30D / 20% OTM / 12.5% exposure / Trim 10% every +1000% / Drawdown + MA10 | Trim 10% every +1000% | Drawdown + MA10 | No premium filter | $664,342 | 564.34% | 35.24% | -50.58% | 2021-04-14 -> 2023-01-13 | -73.56% | 5 | 45.45% | 13,133 | 0 | 663 | 2021-04-14 -> 2023-02-06 | 6.66% | -20.21% | 1,963 | 2019-11-26 -> 2025-04-11 | -95.56% | 301.92% | 1,050.46% | 30.05 | 19.85% | 1.34% | 45.50 | 246 | |
| TSLA buy & hold | Benchmark | Benchmark | Benchmark | $1,220,188 | 1,120.19% | 49.01% | -73.63% | 2021-11-04 -> 2023-01-03 | -73.63% | — | — | 16,572 | 16,572 | 1,133 | 2021-11-04 -> 2024-12-11 | 3.61% | 3.61% | 0 | 2019-01-02 -> 2019-01-02 | 0.00% | 0.00% | 0.00% | — | — | — | — | — |
Top Stage 4 NAV Curves
Stage 4 Winner One-Year Fresh Starts
| Strategy | Window | Window type | Call return | TSLA return | Excess vs TSLA | Beat TSLA | Call max DD | TSLA max DD | Trades |
|---|---|---|---|---|---|---|---|---|---|
| 30D / 20% OTM / 12.5% exposure / Trim 25% every +2000% | 2019 | calendar_year | 253.34% | 34.89% | 218.45% | yes | -74.33% | -48.46% | 52 |
| TSLA buy & hold | 2019 | calendar_year | 34.89% | 34.89% | 0.00% | — | -48.46% | -48.46% | — |
| 30D / 20% OTM / 12.5% exposure / Trim 25% every +2000% | 2019 Jul-Jun | jul_to_jun | 7,470.18% | 375.28% | 7,094.91% | yes | -44.62% | -60.62% | 53 |
| TSLA buy & hold | 2019 Jul-Jun | jul_to_jun | 375.28% | 375.28% | 0.00% | — | -60.62% | -60.62% | — |
| 30D / 20% OTM / 12.5% exposure / Trim 25% every +2000% | 2020 | calendar_year | 4,060.11% | 720.00% | 3,340.12% | yes | -55.62% | -60.62% | 52 |
| TSLA buy & hold | 2020 | calendar_year | 720.00% | 720.00% | 0.00% | — | -60.62% | -60.62% | — |
| 30D / 20% OTM / 12.5% exposure / Trim 25% every +2000% | 2020 Jul-Jun | jul_to_jun | 125.31% | 203.43% | -78.11% | no | -65.30% | -36.24% | 52 |
| TSLA buy & hold | 2020 Jul-Jun | jul_to_jun | 203.43% | 203.43% | 0.00% | — | -36.24% | -36.24% | — |
| 30D / 20% OTM / 12.5% exposure / Trim 25% every +2000% | 2021 | calendar_year | 98.37% | 29.45% | 68.92% | yes | -69.64% | -36.19% | 51 |
| TSLA buy & hold | 2021 | calendar_year | 29.45% | 29.45% | 0.00% | — | -36.19% | -36.19% | — |
| 30D / 20% OTM / 12.5% exposure / Trim 25% every +2000% | 2021 Jul-Jun | jul_to_jun | 140.68% | -0.66% | 141.34% | yes | -63.03% | -48.89% | 52 |
| TSLA buy & hold | 2021 Jul-Jun | jul_to_jun | -0.66% | -0.66% | 0.00% | — | -48.89% | -48.89% | — |
| 30D / 20% OTM / 12.5% exposure / Trim 25% every +2000% | 2022 | calendar_year | -61.43% | -69.19% | 7.75% | yes | -74.68% | -72.71% | 52 |
| TSLA buy & hold | 2022 | calendar_year | -69.19% | -69.19% | 0.00% | — | -72.71% | -72.71% | — |
| 30D / 20% OTM / 12.5% exposure / Trim 25% every +2000% | 2022 Jul-Jun | jul_to_jun | 498.50% | 15.18% | 483.32% | yes | -62.57% | -65.05% | 52 |
| TSLA buy & hold | 2022 Jul-Jun | jul_to_jun | 15.18% | 15.18% | 0.00% | — | -65.05% | -65.05% | — |
| 30D / 20% OTM / 12.5% exposure / Trim 25% every +2000% | 2023 | calendar_year | 382.29% | 129.85% | 252.44% | yes | -46.86% | -32.72% | 52 |
| TSLA buy & hold | 2023 | calendar_year | 129.85% | 129.85% | 0.00% | — | -32.72% | -32.72% | — |
| 30D / 20% OTM / 12.5% exposure / Trim 25% every +2000% | 2023 Jul-Jun | jul_to_jun | -75.28% | -29.25% | -46.03% | no | -78.63% | -51.52% | 52 |
| TSLA buy & hold | 2023 Jul-Jun | jul_to_jun | -29.25% | -29.25% | 0.00% | — | -51.52% | -51.52% | — |
| 30D / 20% OTM / 12.5% exposure / Trim 25% every +2000% | 2024 | calendar_year | 330.96% | 67.93% | 263.03% | yes | -53.48% | -42.76% | 52 |
| TSLA buy & hold | 2024 | calendar_year | 67.93% | 67.93% | 0.00% | — | -42.76% | -42.76% | — |
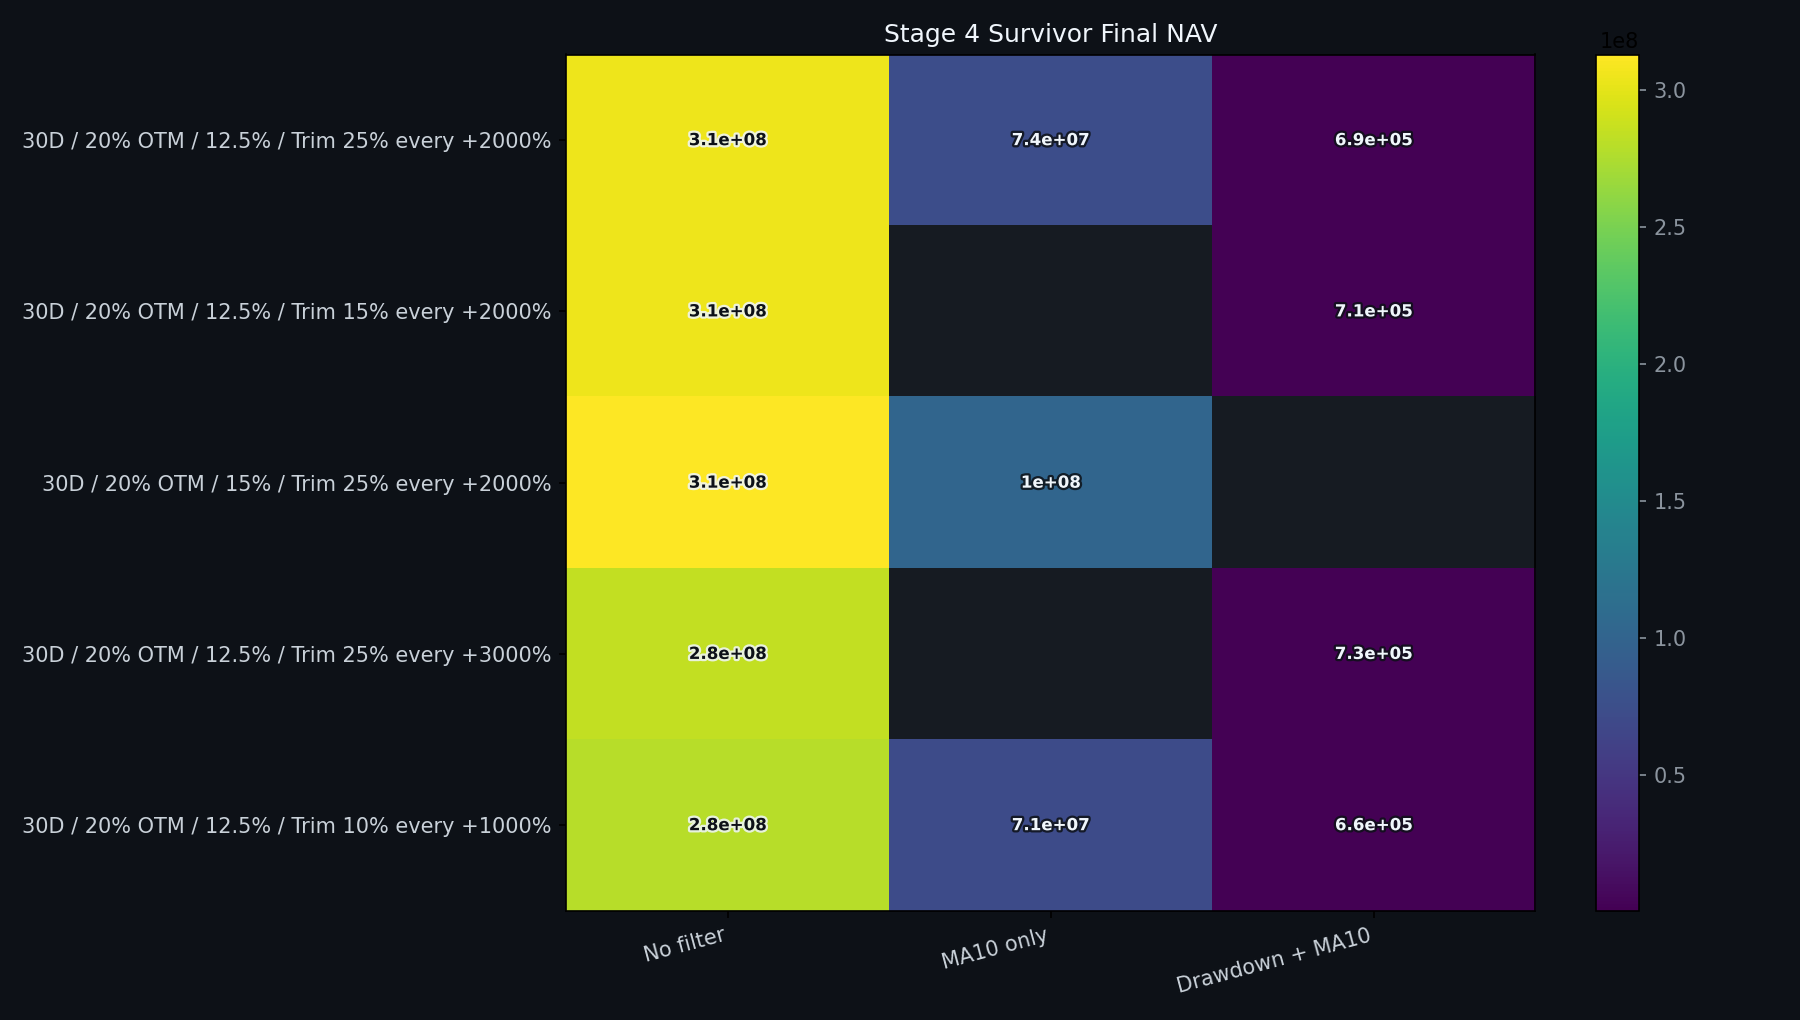
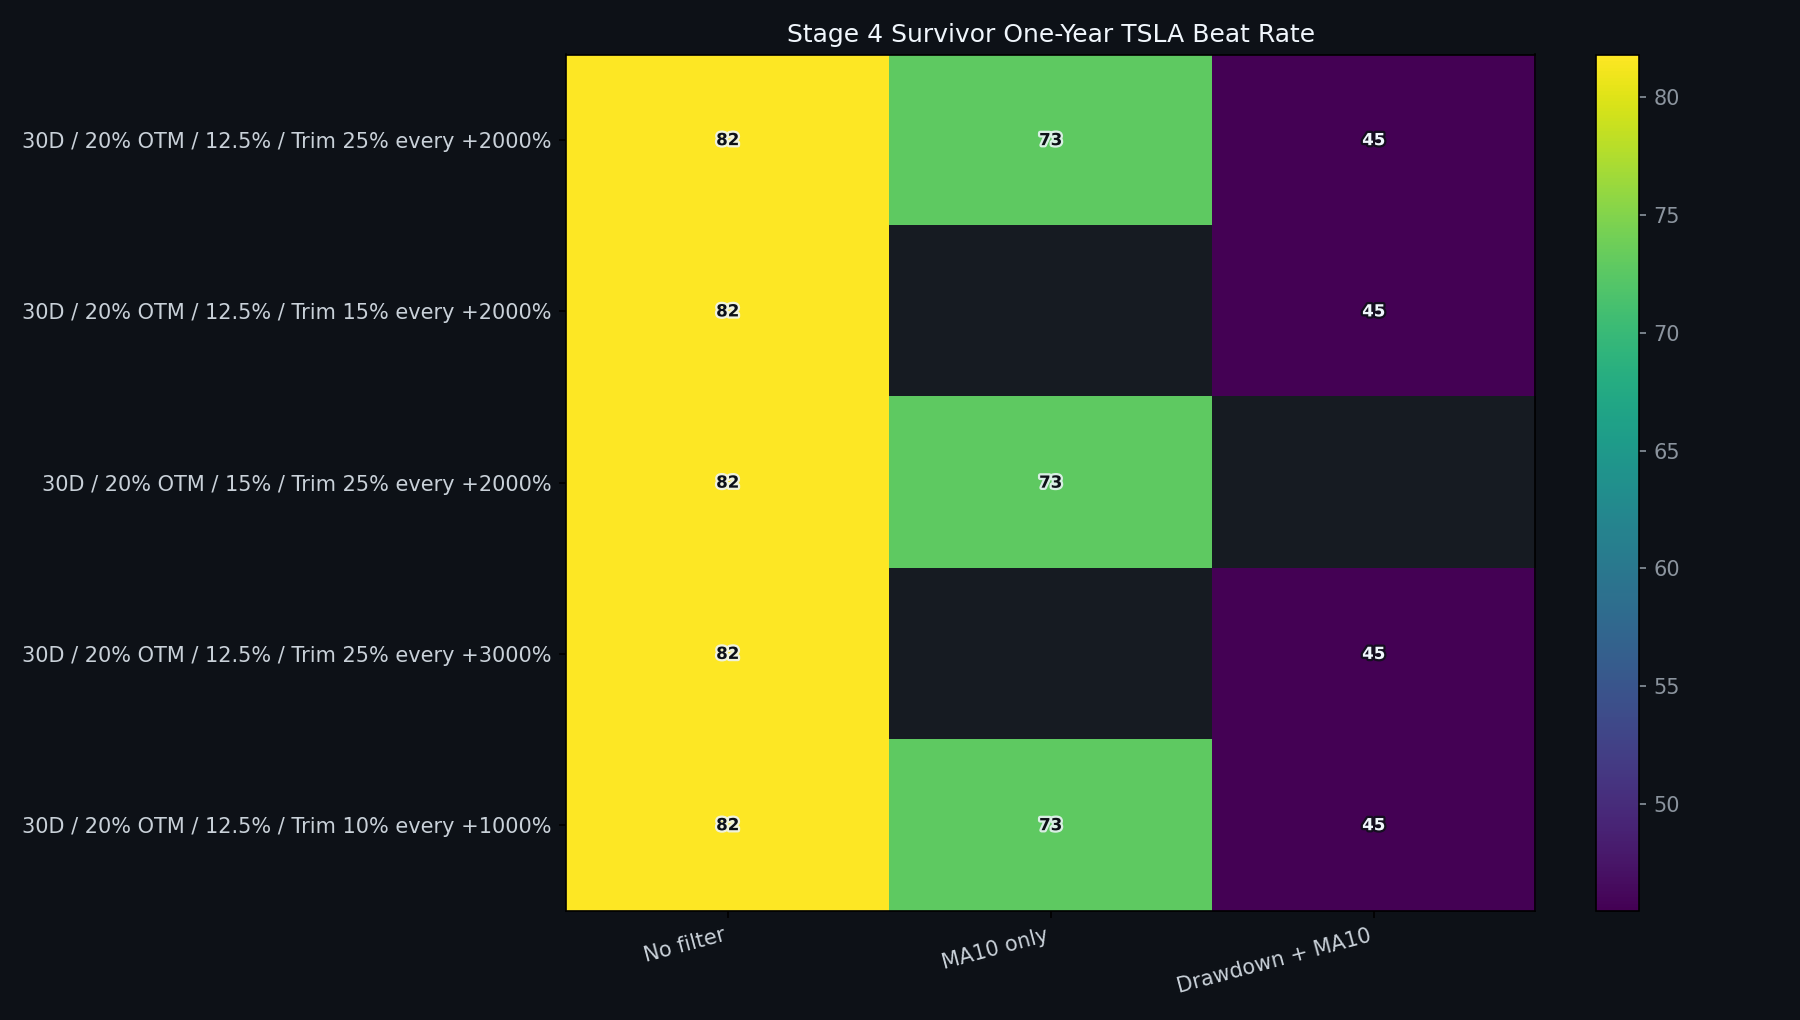
Stage 4 Heatmaps
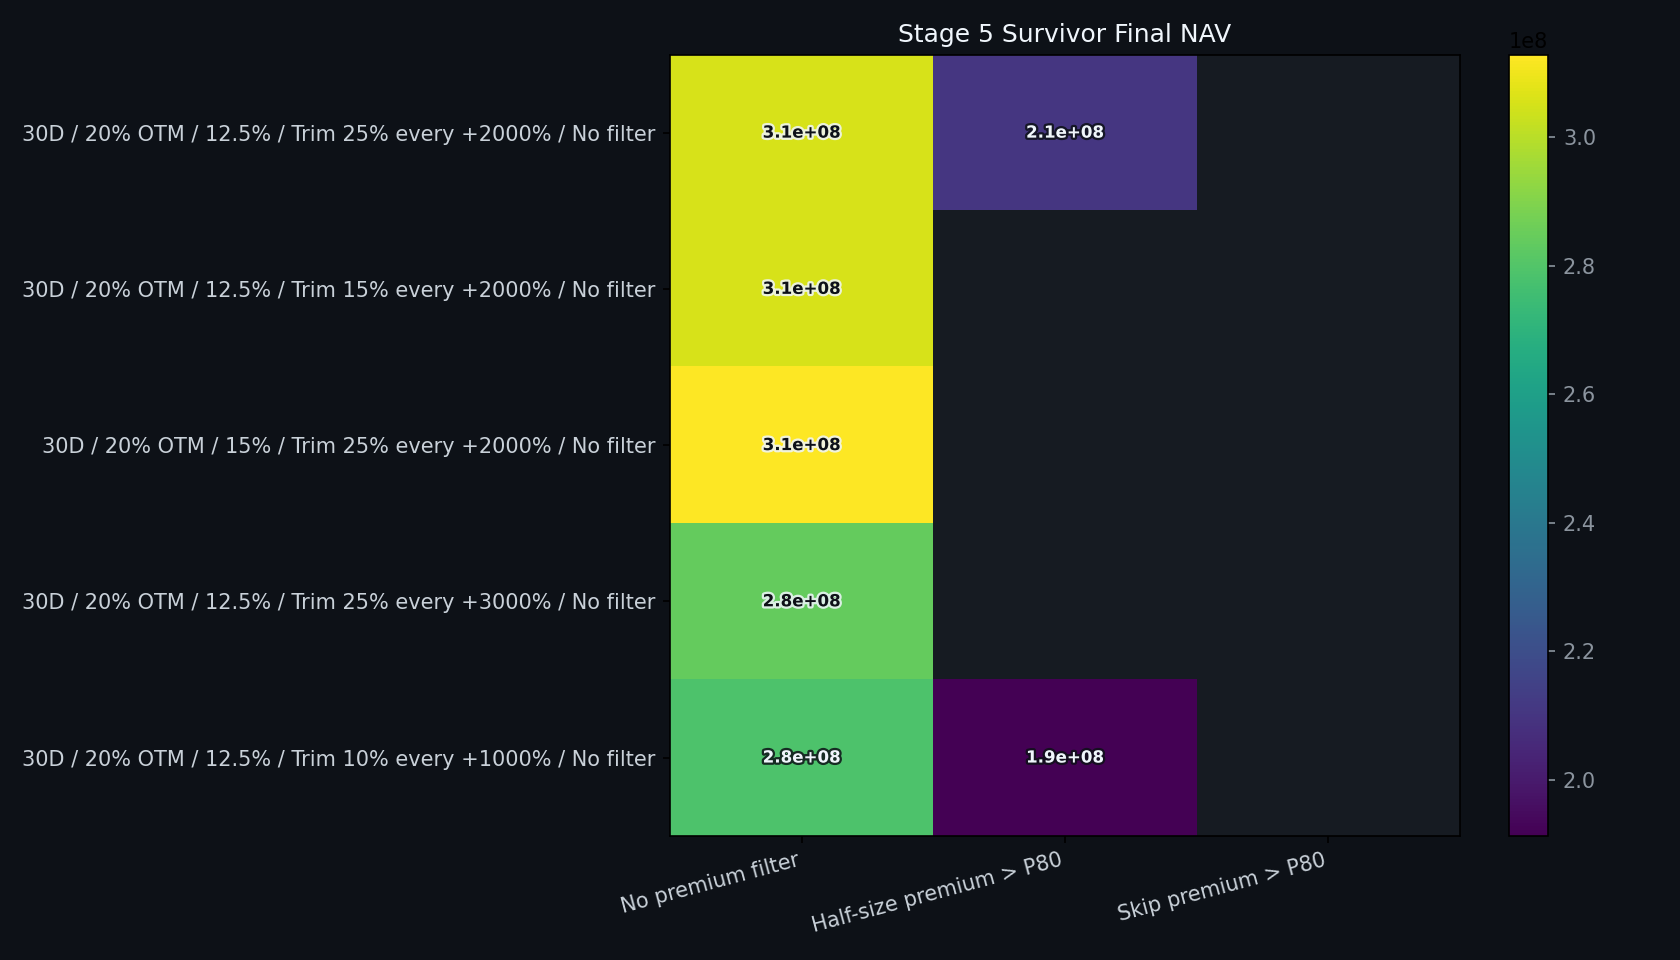
Stage 5: Volatility / Premium Filter
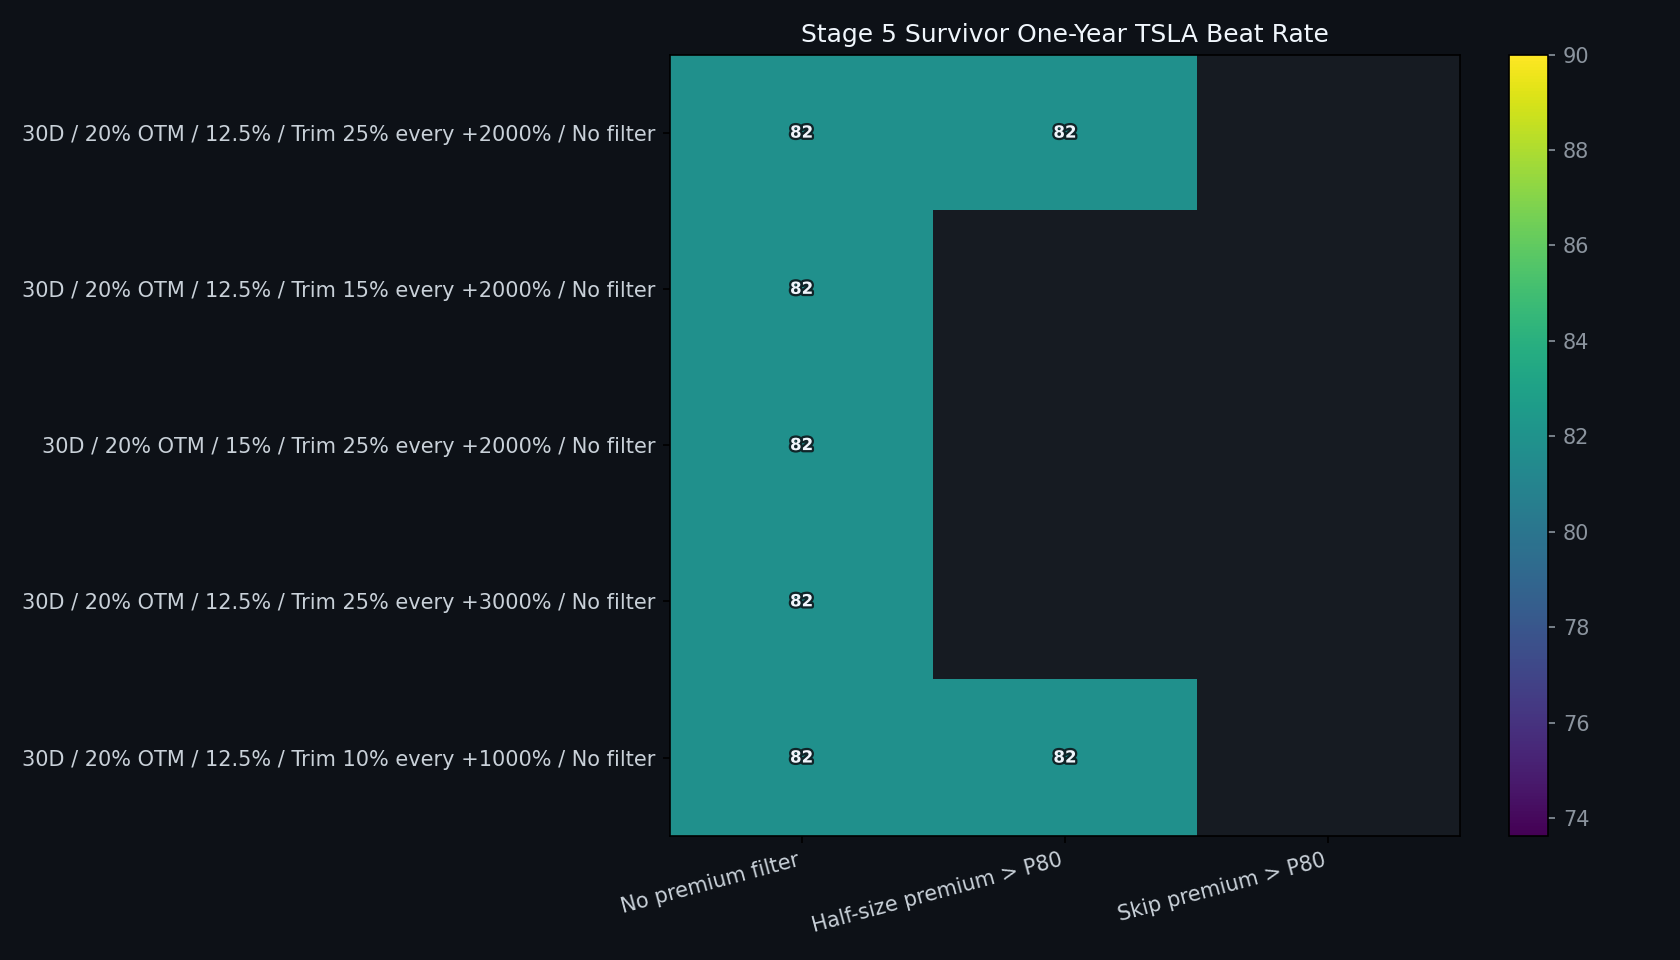
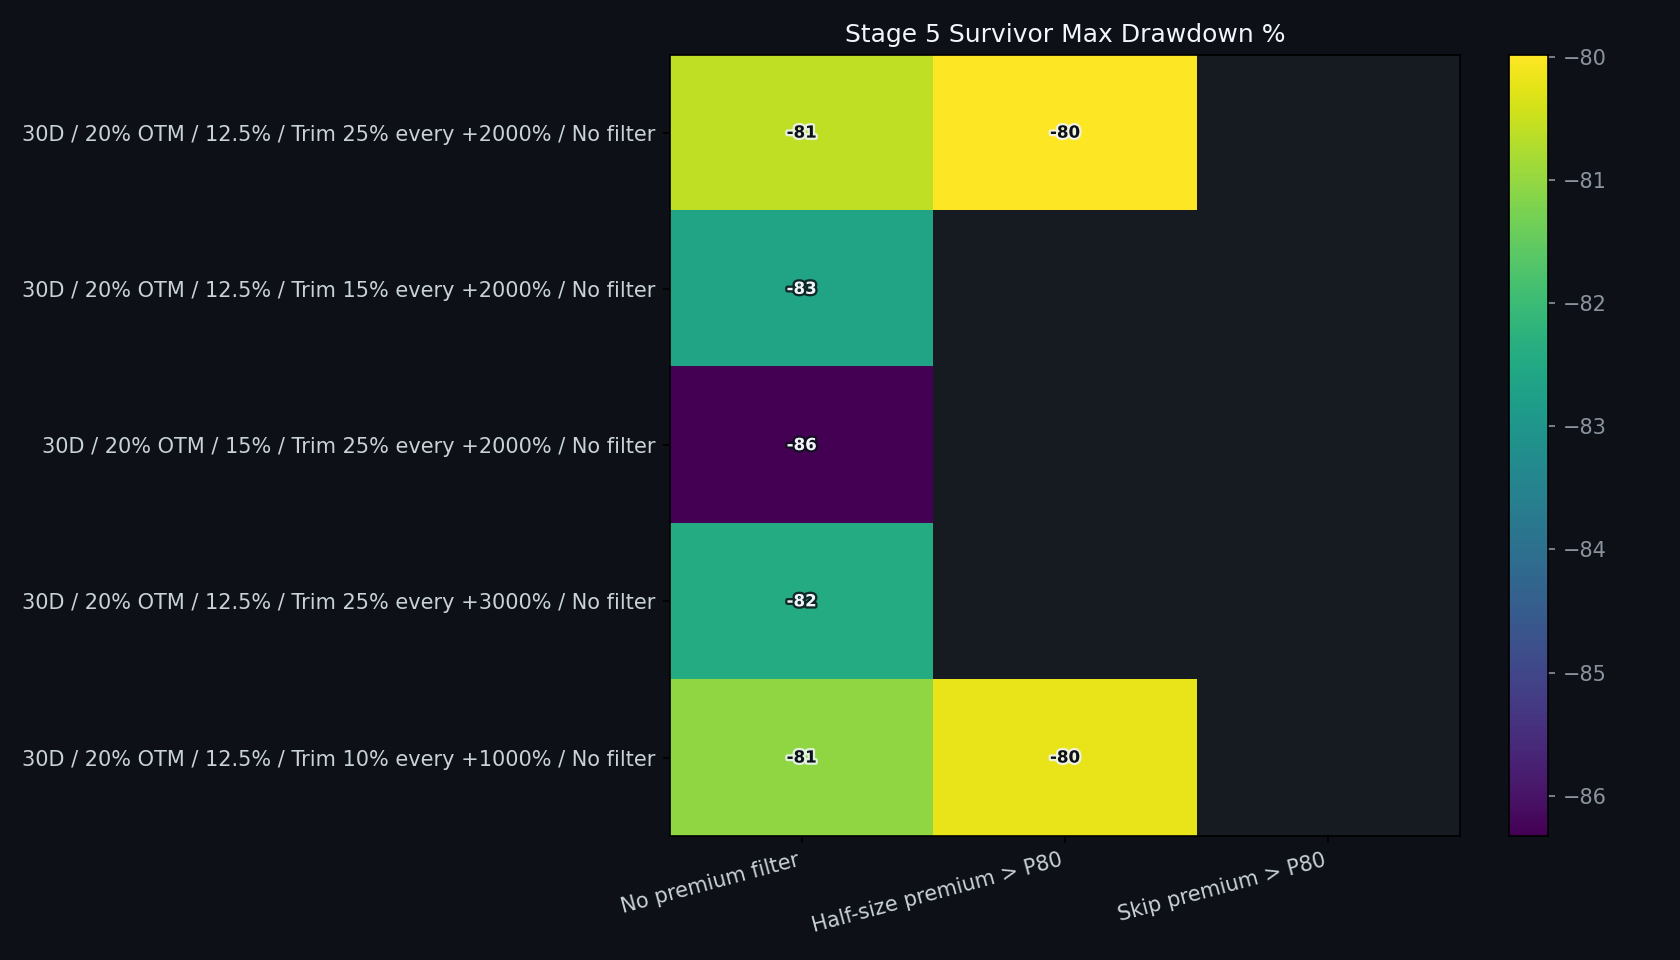
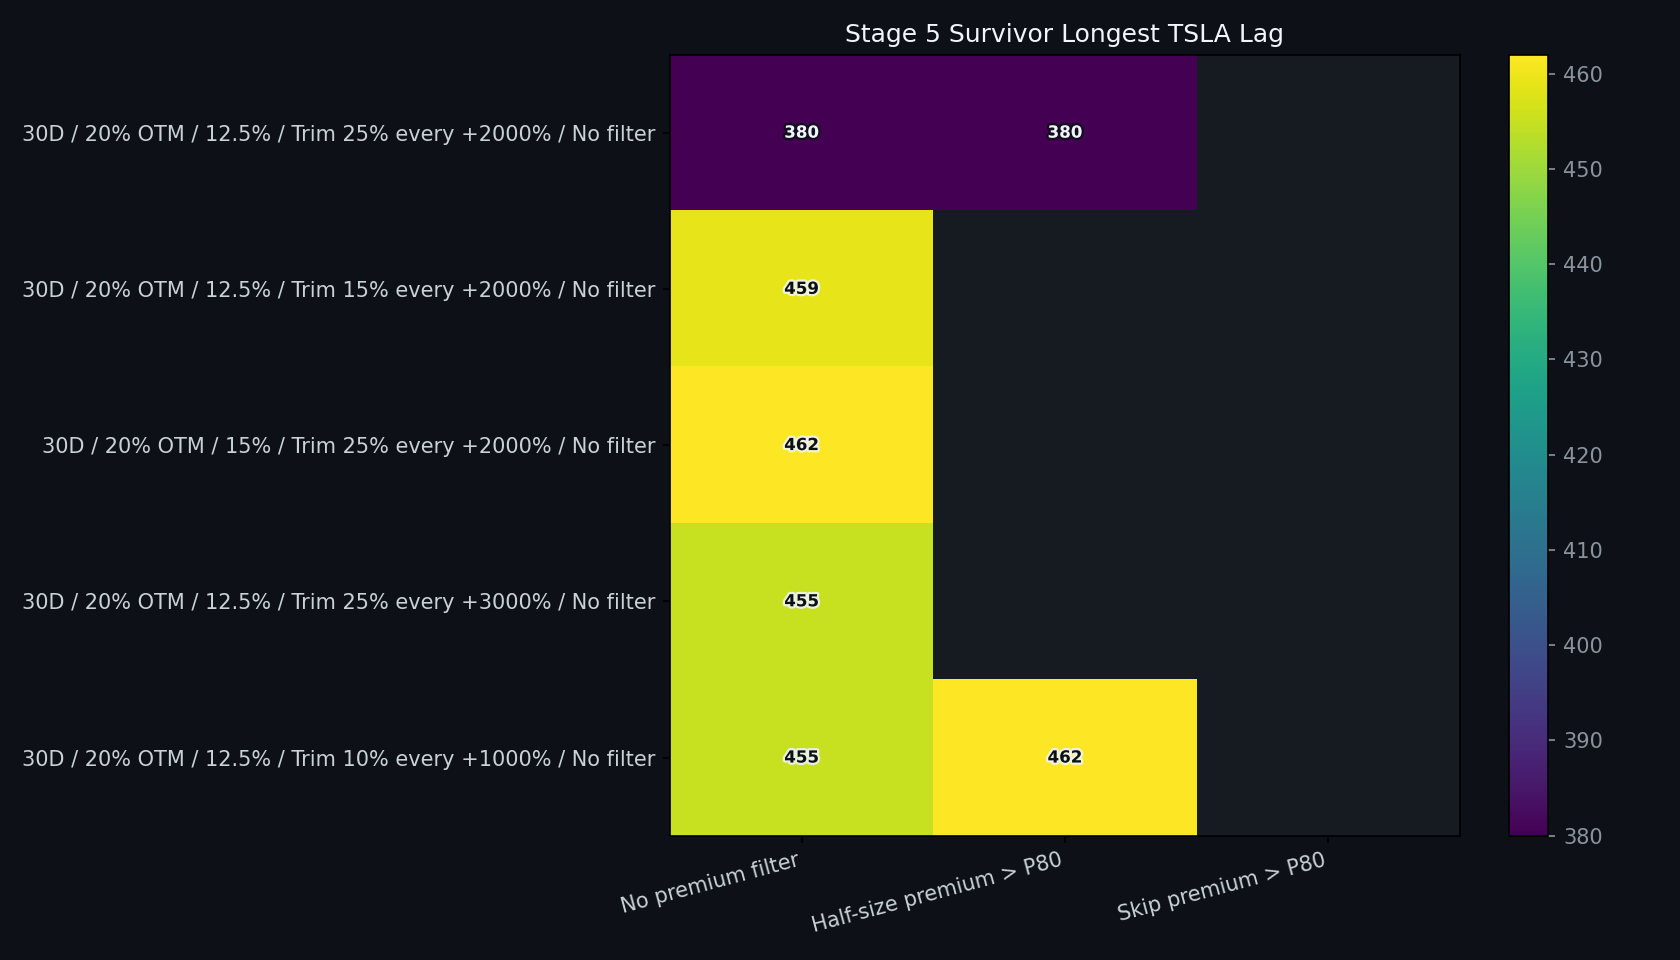
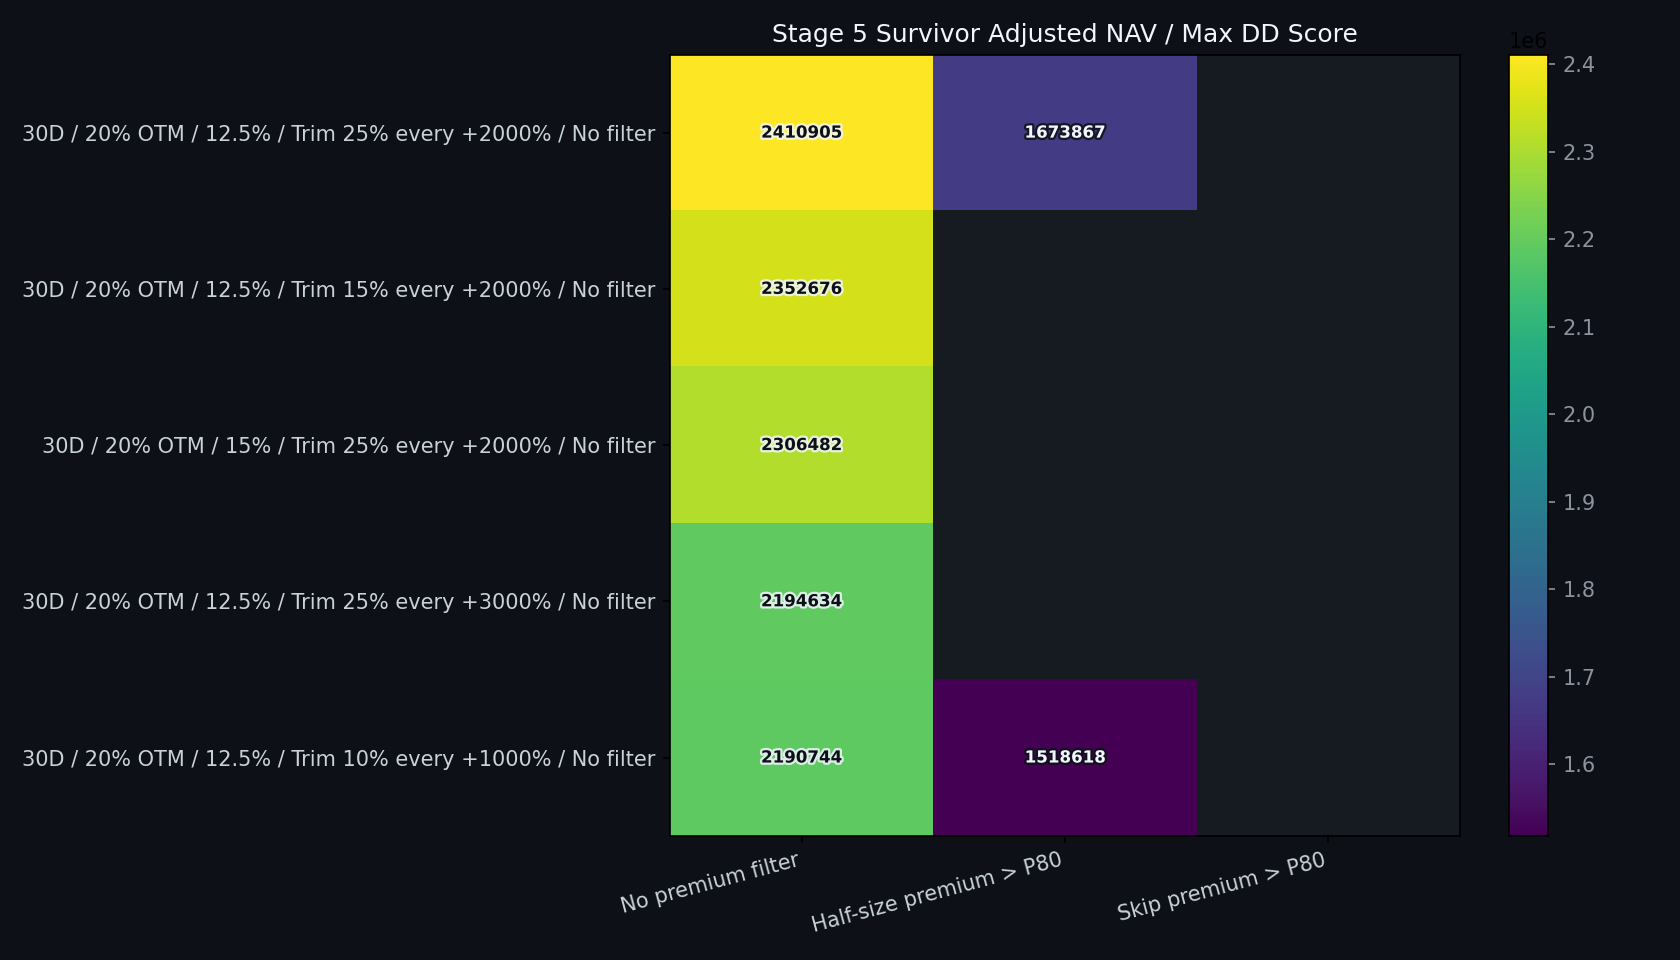
Stage 5 takes the top 5 non-dominated Stage 4 candidates by beat-rate adjusted NAV/max-DD score plus the top 3 by final NAV, de-duplicated, and tests three premium rules: no premium filter, half-size buys when the selected call's premium/spot ratio is at or above its no-lookahead 80th percentile, and skip buys at that same premium threshold.
Stage 5 Carry-Forward Parents
| Parent strategy | Selected by | Score rank | Final NAV rank | Final NAV | Max DD | Drawdown period | Tesla drawdown in that window | Beat rate | Base NAV/DD | Beat-rate adjusted NAV / max DD score | Longest negative period | Longest TSLA lag | Worst lag vs TSLA |
|---|---|---|---|---|---|---|---|---|---|---|---|---|---|
| 30D / 20% OTM / 12.5% exposure / Trim 25% every +2000% | score + final NAV | 1 | 3 | $305,346,193 | -80.60% | 2021-11-04 -> 2023-01-06 | -73.35% | 81.82% | 3,788,565 | 2,410,905 | 580 | 380 | -61.55% |
| 30D / 20% OTM / 12.5% exposure / Trim 15% every +2000% | score + final NAV | 2 | 2 | $305,437,456 | -82.62% | 2021-11-04 -> 2023-01-06 | -73.35% | 81.82% | 3,697,062 | 2,352,676 | 581 | 459 | -59.45% |
| 30D / 20% OTM / 15% exposure / Trim 25% every +2000% | score + final NAV | 3 | 1 | $312,877,165 | -86.32% | 2021-11-04 -> 2023-01-06 | -73.35% | 81.82% | 3,624,471 | 2,306,482 | 582 | 462 | -64.55% |
| 30D / 20% OTM / 12.5% exposure / Trim 25% every +3000% | score | 4 | — | $284,223,876 | -82.41% | 2021-11-04 -> 2023-01-06 | -73.35% | 81.82% | 3,448,711 | 2,194,634 | 581 | 455 | -58.98% |
| 30D / 20% OTM / 12.5% exposure / Trim 10% every +1000% | score | 5 | — | $278,982,140 | -81.04% | 2021-11-04 -> 2023-01-06 | -73.35% | 81.82% | 3,442,598 | 2,190,744 | 580 | 455 | -55.77% |
| TSLA buy & hold | — | — | — | $1,220,188 | -73.63% | 2021-11-04 -> 2023-01-03 | -73.63% | — | 16,572 | 16,572 | 1,133 | 0 | 0.00% |
Top Stage 5 Candidates
| Strategy | Dominated by | Take profit | Trend filter | Premium filter | Final NAV | Total return | CAGR | Max DD | Drawdown period | Tesla drawdown in that window | Year wins | Beat rate | Base NAV/DD | Beat-rate adjusted NAV / max DD score | Longest negative period | Negative period | Call return in negative period | TSLA return in negative period | Longest TSLA lag | TSLA lag period | Worst lag vs TSLA | Call return in TSLA lag | TSLA return in TSLA lag | Avg DTE | Avg moneyness | Avg prem/spot | Avg prem pctile | Skipped |
|---|---|---|---|---|---|---|---|---|---|---|---|---|---|---|---|---|---|---|---|---|---|---|---|---|---|---|---|---|
| 30D / 20% OTM / 12.5% exposure / Trim 25% every +2000% | Trim 25% every +2000% | No filter | No premium filter | $305,346,193 | 305,246.19% | 259.40% | -80.60% | 2021-11-04 -> 2023-01-06 | -73.35% | 9 | 81.82% | 3,788,565 | 2,410,905 | 580 | 2021-11-04 -> 2023-06-07 | 7.75% | -45.22% | 380 | 2023-06-21 -> 2024-07-05 | -61.55% | 2.23% | -3.06% | 29.64 | 19.86% | 1.67% | 51.12 | 4 | |
| 30D / 20% OTM / 12.5% exposure / Trim 15% every +2000% | Trim 15% every +2000% | No filter | No premium filter | $305,437,456 | 305,337.46% | 259.41% | -82.62% | 2021-11-04 -> 2023-01-06 | -73.35% | 9 | 81.82% | 3,697,062 | 2,352,676 | 581 | 2021-11-04 -> 2023-06-08 | 5.69% | -42.71% | 459 | 2021-11-04 -> 2023-02-06 | -59.45% | -49.18% | -52.49% | 29.64 | 19.86% | 1.67% | 51.12 | 4 | |
| 30D / 20% OTM / 15% exposure / Trim 25% every +2000% | Trim 25% every +2000% | No filter | No premium filter | $312,877,165 | 312,777.16% | 260.80% | -86.32% | 2021-11-04 -> 2023-01-06 | -73.35% | 9 | 81.82% | 3,624,471 | 2,306,482 | 582 | 2021-11-04 -> 2023-06-09 | 39.00% | -40.39% | 462 | 2021-11-04 -> 2023-02-09 | -64.55% | -44.47% | -49.43% | 29.64 | 19.86% | 1.67% | 51.12 | 4 | |
| 30D / 20% OTM / 12.5% exposure / Trim 25% every +3000% | Trim 25% every +3000% | No filter | No premium filter | $284,223,876 | 284,123.88% | 255.31% | -82.41% | 2021-11-04 -> 2023-01-06 | -73.35% | 9 | 81.82% | 3,448,711 | 2,194,634 | 581 | 2021-11-04 -> 2023-06-08 | 6.55% | -42.71% | 455 | 2021-11-04 -> 2023-02-02 | -58.98% | -53.83% | -54.08% | 29.64 | 19.86% | 1.67% | 51.12 | 4 | |
| 30D / 20% OTM / 12.5% exposure / Trim 10% every +1000% | Trim 10% every +1000% | No filter | No premium filter | $278,982,140 | 278,882.14% | 254.26% | -81.04% | 2021-11-04 -> 2023-01-06 | -73.35% | 9 | 81.82% | 3,442,598 | 2,190,744 | 580 | 2021-11-04 -> 2023-06-07 | 2.94% | -45.22% | 455 | 2021-11-04 -> 2023-02-02 | -55.77% | -50.22% | -54.08% | 29.64 | 19.86% | 1.67% | 51.12 | 4 | |
| 30D / 20% OTM / 15% exposure / Trim 25% every +2000% / Half-size premium > P80 | 30D / 20% OTM / 12.5% exposure / Trim 25% every +2000% | Trim 25% every +2000% | No filter | Half-size premium > P80 | $227,350,695 | 227,250.70% | 242.89% | -85.73% | 2021-01-08 -> 2021-10-14 | -36.15% | 9 | 81.82% | 2,651,914 | 1,687,581 | 582 | 2021-11-04 -> 2023-06-09 | 18.55% | -40.39% | 430 | 2022-03-29 -> 2023-06-02 | -64.64% | -38.41% | -41.62% | 29.64 | 19.86% | 1.67% | 51.12 | 4 |
| 30D / 20% OTM / 12.5% exposure / Trim 25% every +2000% / Half-size premium > P80 | Trim 25% every +2000% | No filter | Half-size premium > P80 | $210,383,941 | 210,283.94% | 238.67% | -79.98% | 2021-01-08 -> 2021-10-14 | -36.15% | 9 | 81.82% | 2,630,362 | 1,673,867 | 581 | 2021-11-04 -> 2023-06-08 | 1.26% | -42.71% | 380 | 2023-06-21 -> 2024-07-05 | -61.55% | 2.23% | -3.06% | 29.64 | 19.86% | 1.67% | 51.12 | 4 | |
| 30D / 20% OTM / 12.5% exposure / Trim 15% every +2000% / Half-size premium > P80 | 30D / 20% OTM / 12.5% exposure / Trim 10% every +1000% | Trim 15% every +2000% | No filter | Half-size premium > P80 | $209,689,090 | 209,589.09% | 238.50% | -81.84% | 2021-11-04 -> 2023-01-06 | -73.35% | 9 | 81.82% | 2,562,289 | 1,630,548 | 582 | 2021-11-04 -> 2023-06-09 | 26.66% | -40.39% | 462 | 2021-11-04 -> 2023-02-09 | -59.00% | -49.27% | -49.43% | 29.64 | 19.86% | 1.67% | 51.12 | 4 |
| 30D / 20% OTM / 12.5% exposure / Trim 10% every +1000% / Half-size premium > P80 | Trim 10% every +1000% | No filter | Half-size premium > P80 | $191,351,942 | 191,251.94% | 233.59% | -80.18% | 2021-11-04 -> 2023-01-06 | -73.35% | 9 | 81.82% | 2,386,399 | 1,518,618 | 582 | 2021-11-04 -> 2023-06-09 | 34.08% | -40.39% | 462 | 2021-11-04 -> 2023-02-09 | -55.27% | -45.35% | -49.43% | 29.64 | 19.86% | 1.67% | 51.12 | 4 | |
| 30D / 20% OTM / 12.5% exposure / Trim 25% every +3000% / Half-size premium > P80 | 30D / 20% OTM / 12.5% exposure / Trim 10% every +1000% | Trim 25% every +3000% | No filter | Half-size premium > P80 | $191,627,793 | 191,527.79% | 233.67% | -81.63% | 2021-11-04 -> 2023-01-06 | -73.35% | 9 | 81.82% | 2,347,607 | 1,493,932 | 582 | 2021-11-04 -> 2023-06-09 | 31.85% | -40.39% | 462 | 2021-11-04 -> 2023-02-09 | -58.52% | -48.70% | -49.43% | 29.64 | 19.86% | 1.67% | 51.12 | 4 |
| 30D / 20% OTM / 12.5% exposure / Trim 25% every +2000% / Skip premium > P80 | 30D / 20% OTM / 12.5% exposure / Trim 25% every +2000% / Half-size premium > P80 | Trim 25% every +2000% | No filter | Skip premium > P80 | $109,725,604 | 109,625.60% | 205.29% | -80.43% | 2021-01-08 -> 2021-10-14 | -36.15% | 9 | 81.82% | 1,364,267 | 868,170 | 582 | 2021-11-04 -> 2023-06-09 | 12.58% | -40.39% | 595 | 2020-03-18 -> 2021-11-03 | -83.55% | 1,632.85% | 1,579.99% | 29.65 | 20.01% | 1.23% | 43.32 | 57 |
| 30D / 20% OTM / 15% exposure / Trim 25% every +2000% / Skip premium > P80 | 30D / 20% OTM / 12.5% exposure / Trim 25% every +2000% | Trim 25% every +2000% | No filter | Skip premium > P80 | $115,339,673 | 115,239.67% | 207.73% | -86.19% | 2021-01-08 -> 2021-10-14 | -36.15% | 9 | 81.82% | 1,338,222 | 851,596 | 586 | 2021-11-04 -> 2023-06-13 | 7.64% | -36.90% | 435 | 2022-03-29 -> 2023-06-07 | -64.90% | -33.50% | -38.73% | 29.65 | 20.01% | 1.23% | 43.32 | 57 |
| 30D / 20% OTM / 12.5% exposure / Trim 15% every +2000% / Skip premium > P80 | 30D / 20% OTM / 12.5% exposure / Trim 25% every +2000% | Trim 15% every +2000% | No filter | Skip premium > P80 | $108,457,302 | 108,357.30% | 204.72% | -81.19% | 2021-11-04 -> 2023-01-19 | -73.35% | 9 | 81.82% | 1,335,908 | 850,123 | 582 | 2021-11-04 -> 2023-06-09 | 2.85% | -40.39% | 593 | 2020-03-18 -> 2021-11-01 | -83.94% | 1,644.37% | 1,572.69% | 29.65 | 20.01% | 1.23% | 43.32 | 57 |
| 30D / 20% OTM / 12.5% exposure / Trim 25% every +3000% / Skip premium > P80 | 30D / 20% OTM / 12.5% exposure / Trim 25% every +2000% | Trim 25% every +3000% | No filter | Skip premium > P80 | $96,246,504 | 96,146.50% | 198.98% | -80.97% | 2021-11-04 -> 2023-01-19 | -73.35% | 9 | 81.82% | 1,188,596 | 756,379 | 582 | 2021-11-04 -> 2023-06-09 | 6.93% | -40.39% | 593 | 2020-03-18 -> 2021-11-01 | -84.52% | 1,579.22% | 1,572.69% | 29.65 | 20.01% | 1.23% | 43.32 | 57 |
| 30D / 20% OTM / 12.5% exposure / Trim 10% every +1000% / Skip premium > P80 | 30D / 20% OTM / 12.5% exposure / Trim 25% every +2000% / Half-size premium > P80 | Trim 10% every +1000% | No filter | Skip premium > P80 | $99,204,246 | 99,104.25% | 200.42% | -80.43% | 2021-01-08 -> 2021-10-14 | -36.15% | 9 | 81.82% | 1,233,462 | 784,930 | 582 | 2021-11-04 -> 2023-06-09 | 8.96% | -40.39% | 595 | 2020-03-18 -> 2021-11-03 | -84.32% | 1,586.22% | 1,579.99% | 29.65 | 20.01% | 1.23% | 43.32 | 57 |
| TSLA buy & hold | Benchmark | Benchmark | Benchmark | $1,220,188 | 1,120.19% | 49.01% | -73.63% | 2021-11-04 -> 2023-01-03 | -73.63% | — | — | 16,572 | 16,572 | 1,133 | 2021-11-04 -> 2024-12-11 | 3.61% | 3.61% | 0 | 2019-01-02 -> 2019-01-02 | 0.00% | 0.00% | 0.00% | — | — | — | — | — |
Top Stage 5 NAV Curves
Stage 5 Winner One-Year Fresh Starts
| Strategy | Window | Window type | Call return | TSLA return | Excess vs TSLA | Beat TSLA | Call max DD | TSLA max DD | Trades |
|---|---|---|---|---|---|---|---|---|---|
| 30D / 20% OTM / 12.5% exposure / Trim 25% every +2000% | 2019 | calendar_year | 253.34% | 34.89% | 218.45% | yes | -74.33% | -48.46% | 52 |
| TSLA buy & hold | 2019 | calendar_year | 34.89% | 34.89% | 0.00% | — | -48.46% | -48.46% | — |
| 30D / 20% OTM / 12.5% exposure / Trim 25% every +2000% | 2019 Jul-Jun | jul_to_jun | 7,470.18% | 375.28% | 7,094.91% | yes | -44.62% | -60.62% | 53 |
| TSLA buy & hold | 2019 Jul-Jun | jul_to_jun | 375.28% | 375.28% | 0.00% | — | -60.62% | -60.62% | — |
| 30D / 20% OTM / 12.5% exposure / Trim 25% every +2000% | 2020 | calendar_year | 4,060.11% | 720.00% | 3,340.12% | yes | -55.62% | -60.62% | 52 |
| TSLA buy & hold | 2020 | calendar_year | 720.00% | 720.00% | 0.00% | — | -60.62% | -60.62% | — |
| 30D / 20% OTM / 12.5% exposure / Trim 25% every +2000% | 2020 Jul-Jun | jul_to_jun | 125.31% | 203.43% | -78.11% | no | -65.30% | -36.24% | 52 |
| TSLA buy & hold | 2020 Jul-Jun | jul_to_jun | 203.43% | 203.43% | 0.00% | — | -36.24% | -36.24% | — |
| 30D / 20% OTM / 12.5% exposure / Trim 25% every +2000% | 2021 | calendar_year | 98.37% | 29.45% | 68.92% | yes | -69.64% | -36.19% | 51 |
| TSLA buy & hold | 2021 | calendar_year | 29.45% | 29.45% | 0.00% | — | -36.19% | -36.19% | — |
| 30D / 20% OTM / 12.5% exposure / Trim 25% every +2000% | 2021 Jul-Jun | jul_to_jun | 140.68% | -0.66% | 141.34% | yes | -63.03% | -48.89% | 52 |
| TSLA buy & hold | 2021 Jul-Jun | jul_to_jun | -0.66% | -0.66% | 0.00% | — | -48.89% | -48.89% | — |
| 30D / 20% OTM / 12.5% exposure / Trim 25% every +2000% | 2022 | calendar_year | -61.43% | -69.19% | 7.75% | yes | -74.68% | -72.71% | 52 |
| TSLA buy & hold | 2022 | calendar_year | -69.19% | -69.19% | 0.00% | — | -72.71% | -72.71% | — |
| 30D / 20% OTM / 12.5% exposure / Trim 25% every +2000% | 2022 Jul-Jun | jul_to_jun | 498.50% | 15.18% | 483.32% | yes | -62.57% | -65.05% | 52 |
| TSLA buy & hold | 2022 Jul-Jun | jul_to_jun | 15.18% | 15.18% | 0.00% | — | -65.05% | -65.05% | — |
| 30D / 20% OTM / 12.5% exposure / Trim 25% every +2000% | 2023 | calendar_year | 382.29% | 129.85% | 252.44% | yes | -46.86% | -32.72% | 52 |
| TSLA buy & hold | 2023 | calendar_year | 129.85% | 129.85% | 0.00% | — | -32.72% | -32.72% | — |
| 30D / 20% OTM / 12.5% exposure / Trim 25% every +2000% | 2023 Jul-Jun | jul_to_jun | -75.28% | -29.25% | -46.03% | no | -78.63% | -51.52% | 52 |
| TSLA buy & hold | 2023 Jul-Jun | jul_to_jun | -29.25% | -29.25% | 0.00% | — | -51.52% | -51.52% | — |
| 30D / 20% OTM / 12.5% exposure / Trim 25% every +2000% | 2024 | calendar_year | 330.96% | 67.93% | 263.03% | yes | -53.48% | -42.76% | 52 |
| TSLA buy & hold | 2024 | calendar_year | 67.93% | 67.93% | 0.00% | — | -42.76% | -42.76% | — |
Stage 5 Heatmaps
Stage 6: Final Fragility Audit
Stage 6 is due diligence, not a new search stage. It audits the Stage 5 winner and close runners-up under alternate start dates and named TSLA regimes, then checks whether final wealth depends too heavily on only a handful of option cycles.
Robustness Read
The Stage 6 audit says the original Stage 5 winner is still the best balanced choice, but not because it dominates every diagnostic. It wins because it keeps the best full-period selection score after the beat-rate adjustment, compounding to $305,346,193 with a full-period max drawdown of -80.60%.
The take-profit result is part of that conclusion: the selected rule is Trim 25% every +2000%. In this run, trims are not being treated as a separate override; they have to earn their place through beat-rate adjusted NAV/max-DD score. That means a trim rule can win only if the lower path risk, better consistency, or lower concentration is worth the upside it gives away.
- Balanced winner: 30D / 20% OTM / 12.5% exposure / Trim 25% every +2000%. It has the best beat-rate adjusted NAV/max-DD score, a 81.82% one-year TSLA beat rate, and the strongest blend of wealth creation and drawdown discipline.
- Maximum wealth variant: 30D / 20% OTM / 15% exposure / Trim 25% every +2000%. It reaches $312,877,165, but the full-period drawdown deepens to -86.32%, so the extra NAV is bought with materially harsher path risk.
- Lowest full-period drawdown finalist: 30D / 20% OTM / 12.5% exposure / Trim 25% every +2000%, at -80.60%. This is more defensive, but it gives up a large amount of final NAV versus the no-filter 10% and 12.5% variants.
- Lowest top-trade dependence: 30D / 20% OTM / 12.5% exposure / Trim 25% every +2000%. Its top five cycles equal 120.02% of final NAV, versus 120.02% for the balanced winner. That makes it less dependent on a few explosive option lots.
Across rolling fresh starts, the shorter horizon evidence favors smaller sizing: 30D / 20% OTM / 12.5% exposure / Trim 15% every +2000% has the best 3-month TSLA beat rate at 46.58%. The 12-month evidence leans back toward higher exposure: 30D / 20% OTM / 12.5% exposure / Trim 15% every +2000% has the strongest median 12-month return at 253.17%.
Across curated regimes, the strongest average beat-rate profile is 30D / 20% OTM / 12.5% exposure / Trim 15% every +2000%, with an average regime beat rate of 87.88%. That does not automatically make it the primary winner, because regime robustness is only one diagnostic and can conflict with full-period compounding and concentration risk.
Audited Candidates
| Strategy | Dominated by | Take profit | Trend filter | Premium filter | Final NAV | Total return | CAGR | Max DD | Drawdown period | Tesla drawdown in that window | Year wins | Beat rate | Base NAV/DD | Beat-rate adjusted NAV / max DD score | Longest negative period | Negative period | Call return in negative period | TSLA return in negative period | Longest TSLA lag | TSLA lag period | Worst lag vs TSLA | Call return in TSLA lag | TSLA return in TSLA lag | Avg DTE | Avg moneyness | Avg prem/spot | Avg prem pctile | Skipped |
|---|---|---|---|---|---|---|---|---|---|---|---|---|---|---|---|---|---|---|---|---|---|---|---|---|---|---|---|---|
| 30D / 20% OTM / 12.5% exposure / Trim 25% every +2000% | Trim 25% every +2000% | No filter | No premium filter | $305,346,193 | 305,246.19% | 259.40% | -80.60% | 2021-11-04 -> 2023-01-06 | -73.35% | 9 | 81.82% | 3,788,565 | 2,410,905 | 580 | 2021-11-04 -> 2023-06-07 | 7.75% | -45.22% | 380 | 2023-06-21 -> 2024-07-05 | -61.55% | 2.23% | -3.06% | 29.64 | 19.86% | 1.67% | 51.12 | 4 | |
| 30D / 20% OTM / 12.5% exposure / Trim 15% every +2000% | Trim 15% every +2000% | No filter | No premium filter | $305,437,456 | 305,337.46% | 259.41% | -82.62% | 2021-11-04 -> 2023-01-06 | -73.35% | 9 | 81.82% | 3,697,062 | 2,352,676 | 581 | 2021-11-04 -> 2023-06-08 | 5.69% | -42.71% | 459 | 2021-11-04 -> 2023-02-06 | -59.45% | -49.18% | -52.49% | 29.64 | 19.86% | 1.67% | 51.12 | 4 | |
| 30D / 20% OTM / 15% exposure / Trim 25% every +2000% | Trim 25% every +2000% | No filter | No premium filter | $312,877,165 | 312,777.16% | 260.80% | -86.32% | 2021-11-04 -> 2023-01-06 | -73.35% | 9 | 81.82% | 3,624,471 | 2,306,482 | 582 | 2021-11-04 -> 2023-06-09 | 39.00% | -40.39% | 462 | 2021-11-04 -> 2023-02-09 | -64.55% | -44.47% | -49.43% | 29.64 | 19.86% | 1.67% | 51.12 | 4 | |
| 30D / 20% OTM / 12.5% exposure / Trim 25% every +3000% | Trim 25% every +3000% | No filter | No premium filter | $284,223,876 | 284,123.88% | 255.31% | -82.41% | 2021-11-04 -> 2023-01-06 | -73.35% | 9 | 81.82% | 3,448,711 | 2,194,634 | 581 | 2021-11-04 -> 2023-06-08 | 6.55% | -42.71% | 455 | 2021-11-04 -> 2023-02-02 | -58.98% | -53.83% | -54.08% | 29.64 | 19.86% | 1.67% | 51.12 | 4 | |
| TSLA buy & hold | Benchmark | Benchmark | Benchmark | $1,220,188 | 1,120.19% | 49.01% | -73.63% | 2021-11-04 -> 2023-01-03 | -73.63% | — | — | 16,572 | 16,572 | 1,133 | 2021-11-04 -> 2024-12-11 | 3.61% | 3.61% | 0 | 2019-01-02 -> 2019-01-02 | 0.00% | 0.00% | 0.00% | — | — | — | — | — |
Rolling Fresh-Start Windows
Each row summarizes monthly fresh starts for a fixed 3-, 6-, or 12-month horizon. Both the option strategy and TSLA buy-and-hold restart at $100,000 on the same first valid date.
| Strategy | Months | Windows | Beat rate | Median return | Mean return | Median excess | Mean excess | Worst excess vs TSLA | Worst call return | Worst max DD | Median final NAV |
|---|---|---|---|---|---|---|---|---|---|---|---|
| 30D / 20% OTM / 12.5% exposure / Trim 15% every +2000% | 3 | 73 | 46.58% | -6.82% | 117.73% | -2.25% | 98.97% | -108.35% | -36.80% | -56.89% | $93,176 |
| 30D / 20% OTM / 12.5% exposure / Trim 25% every +2000% | 3 | 73 | 46.58% | -6.82% | 116.18% | -2.25% | 97.41% | -108.35% | -36.80% | -54.50% | $93,176 |
| 30D / 20% OTM / 12.5% exposure / Trim 25% every +3000% | 3 | 73 | 46.58% | -6.82% | 117.06% | -2.25% | 98.30% | -108.35% | -36.80% | -59.64% | $93,176 |
| 30D / 20% OTM / 15% exposure / Trim 25% every +2000% | 3 | 73 | 43.84% | -9.89% | 145.33% | -6.31% | 126.57% | -103.80% | -43.20% | -61.60% | $90,111 |
| TSLA buy & hold | 3 | 73 | — | 5.63% | 18.76% | 0.00% | 0.00% | 0.00% | -55.33% | -60.62% | $105,626 |
| 30D / 20% OTM / 12.5% exposure / Trim 15% every +2000% | 6 | 71 | 67.61% | 80.21% | 479.21% | 42.75% | 433.43% | -125.80% | -57.52% | -64.62% | $180,205 |
| 30D / 20% OTM / 12.5% exposure / Trim 25% every +2000% | 6 | 71 | 67.61% | 80.44% | 471.70% | 42.75% | 425.92% | -122.89% | -57.52% | -64.87% | $180,441 |
| 30D / 20% OTM / 12.5% exposure / Trim 25% every +3000% | 6 | 71 | 64.79% | 84.27% | 490.22% | 42.75% | 444.44% | -135.44% | -57.52% | -65.39% | $184,274 |
| 30D / 20% OTM / 15% exposure / Trim 25% every +2000% | 6 | 71 | 63.38% | 85.56% | 648.84% | 56.18% | 603.07% | -76.76% | -64.99% | -70.37% | $185,559 |
| TSLA buy & hold | 6 | 71 | — | 17.72% | 45.78% | 0.00% | 0.00% | 0.00% | -45.80% | -64.98% | $117,718 |
| 30D / 20% OTM / 12.5% exposure / Trim 25% every +2000% | 12 | 66 | 81.82% | 244.95% | 2,577.13% | 175.42% | 2,446.74% | -93.82% | -63.91% | -79.00% | $344,955 |
| 30D / 20% OTM / 15% exposure / Trim 25% every +2000% | 12 | 66 | 81.82% | 230.78% | 4,187.87% | 174.74% | 4,057.48% | -104.82% | -71.78% | -84.89% | $330,783 |
| 30D / 20% OTM / 12.5% exposure / Trim 15% every +2000% | 12 | 66 | 81.82% | 253.17% | 2,568.95% | 167.37% | 2,438.56% | -94.78% | -63.91% | -79.02% | $353,170 |
| 30D / 20% OTM / 12.5% exposure / Trim 25% every +3000% | 12 | 66 | 80.30% | 249.70% | 2,581.51% | 146.85% | 2,451.12% | -103.52% | -63.91% | -78.76% | $349,696 |
| TSLA buy & hold | 12 | 66 | — | 35.74% | 130.39% | 0.00% | 0.00% | 0.00% | -72.96% | -72.96% | $135,744 |
Curated Regime Windows
These windows come from config/periods.yaml and are clipped to the real-options data window when needed.
| Regime | Strategy | Windows | Beat rate | Median return | Mean return | Median excess | Mean excess | Worst excess vs TSLA | Worst call return | Worst max DD |
|---|---|---|---|---|---|---|---|---|---|---|
| bad_x3 | 30D / 20% OTM / 12.5% exposure / Trim 25% every +3000% | 4 | 50.00% | 44.70% | 82.22% | 77.38% | 91.46% | -33.30% | -39.79% | -78.63% |
| bad_x3 | 30D / 20% OTM / 12.5% exposure / Trim 15% every +2000% | 4 | 50.00% | 42.33% | 77.52% | 75.01% | 86.76% | -32.99% | -39.49% | -78.63% |
| bad_x3 | 30D / 20% OTM / 12.5% exposure / Trim 25% every +2000% | 4 | 50.00% | 38.47% | 72.70% | 71.14% | 81.94% | -32.99% | -39.49% | -78.63% |
| bad_x3 | 30D / 20% OTM / 15% exposure / Trim 25% every +2000% | 4 | 50.00% | 27.49% | 60.05% | 60.17% | 69.29% | -47.52% | -54.02% | -84.53% |
| bad_x3 | TSLA buy & hold | 4 | — | -17.92% | -9.24% | 0.00% | 0.00% | 0.00% | -36.01% | -73.35% |
| down_strong | 30D / 20% OTM / 12.5% exposure / Trim 25% every +3000% | 2 | 100.00% | 38.43% | 38.43% | 93.12% | 93.12% | 11.02% | -61.94% | -74.81% |
| down_strong | 30D / 20% OTM / 12.5% exposure / Trim 15% every +2000% | 2 | 100.00% | 34.61% | 34.61% | 89.30% | 89.30% | 11.02% | -61.94% | -74.81% |
| down_strong | 30D / 20% OTM / 12.5% exposure / Trim 25% every +2000% | 2 | 100.00% | 31.64% | 31.64% | 86.33% | 86.33% | 11.02% | -61.94% | -74.81% |
| down_strong | 30D / 20% OTM / 15% exposure / Trim 25% every +2000% | 2 | 100.00% | 20.33% | 20.33% | 75.02% | 75.02% | 3.66% | -69.30% | -80.79% |
| down_strong | TSLA buy & hold | 2 | — | -54.69% | -54.69% | 0.00% | 0.00% | 0.00% | -72.96% | -72.96% |
| ends_higher | 30D / 20% OTM / 12.5% exposure / Trim 25% every +3000% | 5 | 100.00% | 246.22% | 256.04% | 219.20% | 223.41% | 3.71% | 58.69% | -75.61% |
| ends_higher | 30D / 20% OTM / 12.5% exposure / Trim 25% every +2000% | 5 | 100.00% | 239.35% | 246.36% | 212.33% | 213.73% | 14.03% | 69.00% | -75.61% |
| ends_higher | 30D / 20% OTM / 12.5% exposure / Trim 15% every +2000% | 5 | 100.00% | 237.26% | 252.09% | 210.24% | 219.46% | 14.29% | 69.27% | -75.61% |
| ends_higher | 30D / 20% OTM / 15% exposure / Trim 25% every +2000% | 5 | 100.00% | 228.07% | 248.60% | 201.05% | 215.97% | 0.91% | 55.89% | -82.02% |
| ends_higher | TSLA buy & hold | 5 | — | 27.02% | 32.63% | 0.00% | 0.00% | 0.00% | 19.77% | -53.72% |
| ends_lower | 30D / 20% OTM / 12.5% exposure / Trim 25% every +3000% | 2 | 50.00% | 22.64% | 22.64% | 48.33% | 48.33% | -28.67% | -45.60% | -79.91% |
| ends_lower | 30D / 20% OTM / 12.5% exposure / Trim 15% every +2000% | 2 | 50.00% | 19.71% | 19.71% | 45.40% | 45.40% | -28.37% | -45.30% | -79.91% |
| ends_lower | 30D / 20% OTM / 12.5% exposure / Trim 25% every +2000% | 2 | 50.00% | 16.56% | 16.56% | 42.25% | 42.25% | -28.37% | -45.30% | -79.91% |
| ends_lower | 30D / 20% OTM / 15% exposure / Trim 25% every +2000% | 2 | 50.00% | 4.54% | 4.54% | 30.23% | 30.23% | -35.83% | -52.76% | -84.17% |
| ends_lower | TSLA buy & hold | 2 | — | -25.69% | -25.69% | 0.00% | 0.00% | 0.00% | -34.44% | -72.73% |
| flat | 30D / 20% OTM / 12.5% exposure / Trim 25% every +3000% | 2 | 100.00% | 447.66% | 447.66% | 455.32% | 455.32% | 178.49% | 178.27% | -82.77% |
| flat | 30D / 20% OTM / 12.5% exposure / Trim 15% every +2000% | 2 | 100.00% | 437.05% | 437.05% | 444.71% | 444.71% | 177.87% | 177.65% | -82.18% |
| flat | 30D / 20% OTM / 12.5% exposure / Trim 25% every +2000% | 2 | 100.00% | 427.38% | 427.38% | 435.05% | 435.05% | 178.38% | 178.16% | -80.91% |
| flat | 30D / 20% OTM / 15% exposure / Trim 25% every +2000% | 2 | 100.00% | 376.63% | 376.63% | 384.29% | 384.29% | 131.70% | 131.49% | -86.80% |
| flat | TSLA buy & hold | 2 | — | -7.66% | -7.66% | 0.00% | 0.00% | 0.00% | -15.11% | -73.57% |
| full | 30D / 20% OTM / 15% exposure / Trim 25% every +2000% | 1 | 100.00% | 312,777.16% | 312,777.16% | 311,656.98% | 311,656.98% | 311,656.98% | 312,777.16% | -86.32% |
| full | 30D / 20% OTM / 12.5% exposure / Trim 15% every +2000% | 1 | 100.00% | 305,337.46% | 305,337.46% | 304,217.27% | 304,217.27% | 304,217.27% | 305,337.46% | -82.62% |
| full | 30D / 20% OTM / 12.5% exposure / Trim 25% every +2000% | 1 | 100.00% | 305,246.19% | 305,246.19% | 304,126.00% | 304,126.00% | 304,126.00% | 305,246.19% | -80.60% |
| full | 30D / 20% OTM / 12.5% exposure / Trim 25% every +3000% | 1 | 100.00% | 284,123.88% | 284,123.88% | 283,003.69% | 283,003.69% | 283,003.69% | 284,123.88% | -82.41% |
| full | TSLA buy & hold | 1 | — | 1,120.19% | 1,120.19% | 0.00% | 0.00% | 0.00% | 1,120.19% | -73.63% |
| low_dd | 30D / 20% OTM / 15% exposure / Trim 25% every +2000% | 2 | 100.00% | 3,419.12% | 3,419.12% | 3,297.66% | 3,297.66% | 147.93% | 213.26% | -56.63% |
| low_dd | 30D / 20% OTM / 12.5% exposure / Trim 25% every +3000% | 2 | 100.00% | 2,572.30% | 2,572.30% | 2,450.84% | 2,450.84% | 155.03% | 220.36% | -49.79% |
| low_dd | 30D / 20% OTM / 12.5% exposure / Trim 15% every +2000% | 2 | 100.00% | 2,537.83% | 2,537.83% | 2,416.37% | 2,416.37% | 140.57% | 205.90% | -49.79% |
| low_dd | 30D / 20% OTM / 12.5% exposure / Trim 25% every +2000% | 2 | 100.00% | 2,431.34% | 2,431.34% | 2,309.88% | 2,309.88% | 133.52% | 198.84% | -49.79% |
| low_dd | TSLA buy & hold | 2 | — | 121.46% | 121.46% | 0.00% | 0.00% | 0.00% | 65.33% | -16.34% |
| multi_oscillation | 30D / 20% OTM / 12.5% exposure / Trim 15% every +2000% | 1 | 100.00% | 11.52% | 11.52% | 21.34% | 21.34% | 21.34% | 11.52% | -78.63% |
| multi_oscillation | 30D / 20% OTM / 12.5% exposure / Trim 25% every +2000% | 1 | 100.00% | 11.52% | 11.52% | 21.34% | 21.34% | 21.34% | 11.52% | -78.63% |
| multi_oscillation | 30D / 20% OTM / 12.5% exposure / Trim 25% every +3000% | 1 | 100.00% | 10.67% | 10.67% | 20.49% | 20.49% | 20.49% | 10.67% | -78.63% |
| multi_oscillation | 30D / 20% OTM / 15% exposure / Trim 25% every +2000% | 1 | 100.00% | -4.84% | -4.84% | 4.98% | 4.98% | 4.98% | -4.84% | -84.53% |
| multi_oscillation | TSLA buy & hold | 1 | — | -9.82% | -9.82% | 0.00% | 0.00% | 0.00% | -9.82% | -53.73% |
| round_trip_down | 30D / 20% OTM / 12.5% exposure / Trim 15% every +2000% | 3 | 66.67% | -16.13% | 139.34% | 18.03% | 150.50% | -18.93% | -19.96% | -67.94% |
| round_trip_down | 30D / 20% OTM / 12.5% exposure / Trim 25% every +2000% | 3 | 66.67% | -16.13% | 133.62% | 18.03% | 144.78% | -18.63% | -19.65% | -67.94% |
| round_trip_down | 30D / 20% OTM / 12.5% exposure / Trim 25% every +3000% | 3 | 66.67% | -16.13% | 145.92% | 18.03% | 157.08% | -19.24% | -20.26% | -67.94% |
| round_trip_down | 30D / 20% OTM / 15% exposure / Trim 25% every +2000% | 3 | 66.67% | -19.06% | 151.74% | 15.09% | 162.90% | -29.09% | -30.11% | -75.43% |
| round_trip_down | TSLA buy & hold | 3 | — | -1.02% | -11.16% | 0.00% | 0.00% | 0.00% | -34.16% | -56.59% |
| round_trip_up | 30D / 20% OTM / 12.5% exposure / Trim 25% every +3000% | 2 | 100.00% | 109.06% | 109.06% | 106.72% | 106.72% | 69.30% | 73.40% | -66.63% |
| round_trip_up | 30D / 20% OTM / 12.5% exposure / Trim 15% every +2000% | 2 | 100.00% | 105.09% | 105.09% | 102.75% | 102.75% | 63.92% | 68.03% | -67.03% |
| round_trip_up | 30D / 20% OTM / 12.5% exposure / Trim 25% every +2000% | 2 | 100.00% | 100.86% | 100.86% | 98.52% | 98.52% | 57.13% | 61.24% | -63.06% |
| round_trip_up | 30D / 20% OTM / 15% exposure / Trim 25% every +2000% | 2 | 100.00% | 80.14% | 80.14% | 77.80% | 77.80% | 42.10% | 46.21% | -70.30% |
| round_trip_up | TSLA buy & hold | 2 | — | 2.34% | 2.34% | 0.00% | 0.00% | 0.00% | 0.57% | -48.89% |
| up_strong | 30D / 20% OTM / 15% exposure / Trim 25% every +2000% | 2 | 100.00% | 66,598.76% | 66,598.76% | 65,599.32% | 65,599.32% | 1,228.81% | 1,362.20% | -84.87% |
| up_strong | 30D / 20% OTM / 12.5% exposure / Trim 25% every +3000% | 2 | 100.00% | 47,678.04% | 47,678.04% | 46,678.60% | 46,678.60% | 1,254.38% | 1,387.77% | -79.25% |
| up_strong | 30D / 20% OTM / 12.5% exposure / Trim 15% every +2000% | 2 | 100.00% | 46,937.63% | 46,937.63% | 45,938.19% | 45,938.19% | 1,234.58% | 1,367.98% | -79.25% |
| up_strong | 30D / 20% OTM / 12.5% exposure / Trim 25% every +2000% | 2 | 100.00% | 46,777.37% | 46,777.37% | 45,777.93% | 45,777.93% | 1,182.73% | 1,316.13% | -79.25% |
| up_strong | TSLA buy & hold | 2 | — | 999.44% | 999.44% | 0.00% | 0.00% | 0.00% | 133.39% | -60.63% |
Worst 12-Month Starts
Worst starts are sorted by strategy underperformance versus TSLA, then by the option strategy return.
| Strategy | Months | Start | End | Call return | Call final NAV | Call max DD | TSLA return | TSLA final NAV | TSLA max DD | Excess vs TSLA | Beat TSLA | Trades |
|---|---|---|---|---|---|---|---|---|---|---|---|---|
| 30D / 20% OTM / 12.5% exposure / Trim 15% every +2000% | 12 | 2020-07-01 | 2021-07-01 | 122.27% | $222,270 | -65.34% | 202.63% | $302,633 | -36.24% | -80.36% | no | 53 |
| 30D / 20% OTM / 12.5% exposure / Trim 25% every +2000% | 12 | 2020-07-01 | 2021-07-01 | 123.04% | $223,041 | -65.30% | 202.63% | $302,633 | -36.24% | -79.59% | no | 53 |
| 30D / 20% OTM / 12.5% exposure / Trim 25% every +3000% | 12 | 2020-07-01 | 2021-07-01 | 121.24% | $221,238 | -65.44% | 202.63% | $302,633 | -36.24% | -81.39% | no | 53 |
| 30D / 20% OTM / 15% exposure / Trim 25% every +2000% | 12 | 2020-07-01 | 2021-07-01 | 121.02% | $221,019 | -71.59% | 202.63% | $302,633 | -36.24% | -81.61% | no | 53 |
| TSLA buy & hold | 12 | 2020-07-01 | 2021-07-01 | 202.63% | $302,633 | -36.24% | 202.63% | $302,633 | -36.24% | 0.00% | — | — |
| 30D / 20% OTM / 12.5% exposure / Trim 15% every +2000% | 12 | 2020-08-03 | 2021-08-03 | 44.18% | $144,178 | -71.62% | 138.96% | $238,956 | -36.25% | -94.78% | no | 52 |
| 30D / 20% OTM / 12.5% exposure / Trim 25% every +2000% | 12 | 2020-08-03 | 2021-08-03 | 54.01% | $154,008 | -71.69% | 138.96% | $238,956 | -36.25% | -84.95% | no | 52 |
| 30D / 20% OTM / 12.5% exposure / Trim 25% every +3000% | 12 | 2020-08-03 | 2021-08-03 | 35.43% | $135,433 | -71.50% | 138.96% | $238,956 | -36.25% | -103.52% | no | 52 |
| 30D / 20% OTM / 15% exposure / Trim 25% every +2000% | 12 | 2020-08-03 | 2021-08-03 | 42.06% | $142,056 | -78.08% | 138.96% | $238,956 | -36.25% | -96.90% | no | 52 |
| TSLA buy & hold | 12 | 2020-08-03 | 2021-08-03 | 138.96% | $238,956 | -36.25% | 138.96% | $238,956 | -36.25% | 0.00% | — | — |
| 30D / 20% OTM / 12.5% exposure / Trim 15% every +2000% | 12 | 2020-09-01 | 2021-09-01 | -8.85% | $91,150 | -75.07% | 54.48% | $154,485 | -36.23% | -63.33% | no | 52 |
| 30D / 20% OTM / 12.5% exposure / Trim 25% every +2000% | 12 | 2020-09-01 | 2021-09-01 | -8.36% | $91,640 | -74.98% | 54.48% | $154,485 | -36.23% | -62.84% | no | 52 |
| 30D / 20% OTM / 12.5% exposure / Trim 25% every +3000% | 12 | 2020-09-01 | 2021-09-01 | -9.24% | $90,759 | -74.88% | 54.48% | $154,485 | -36.23% | -63.73% | no | 52 |
| 30D / 20% OTM / 15% exposure / Trim 25% every +2000% | 12 | 2020-09-01 | 2021-09-01 | -17.78% | $82,222 | -81.08% | 54.48% | $154,485 | -36.23% | -72.26% | no | 52 |
| TSLA buy & hold | 12 | 2020-09-01 | 2021-09-01 | 54.48% | $154,485 | -36.23% | 54.48% | $154,485 | -36.23% | 0.00% | — | — |
| 30D / 20% OTM / 12.5% exposure / Trim 15% every +2000% | 12 | 2020-10-01 | 2021-10-01 | -21.17% | $78,829 | -78.46% | 72.93% | $172,934 | -36.24% | -94.11% | no | 52 |
| 30D / 20% OTM / 12.5% exposure / Trim 25% every +2000% | 12 | 2020-10-01 | 2021-10-01 | -20.89% | $79,110 | -78.42% | 72.93% | $172,934 | -36.24% | -93.82% | no | 52 |
| 30D / 20% OTM / 12.5% exposure / Trim 25% every +3000% | 12 | 2020-10-01 | 2021-10-01 | -21.53% | $78,472 | -78.43% | 72.93% | $172,934 | -36.24% | -94.46% | no | 52 |
| 30D / 20% OTM / 15% exposure / Trim 25% every +2000% | 12 | 2020-10-01 | 2021-10-01 | -31.88% | $68,115 | -84.28% | 72.93% | $172,934 | -36.24% | -104.82% | no | 52 |
| TSLA buy & hold | 12 | 2020-10-01 | 2021-10-01 | 72.93% | $172,934 | -36.24% | 72.93% | $172,934 | -36.24% | 0.00% | — | — |
| 30D / 20% OTM / 12.5% exposure / Trim 15% every +2000% | 12 | 2023-06-01 | 2024-05-31 | -63.91% | $36,088 | -74.04% | -14.16% | $85,839 | -51.51% | -49.75% | no | 52 |
| 30D / 20% OTM / 12.5% exposure / Trim 25% every +2000% | 12 | 2023-06-01 | 2024-05-31 | -63.91% | $36,088 | -74.04% | -14.16% | $85,839 | -51.51% | -49.75% | no | 52 |
| 30D / 20% OTM / 12.5% exposure / Trim 25% every +3000% | 12 | 2023-06-01 | 2024-05-31 | -63.91% | $36,088 | -74.04% | -14.16% | $85,839 | -51.51% | -49.75% | no | 52 |
| 30D / 20% OTM / 15% exposure / Trim 25% every +2000% | 12 | 2023-06-01 | 2024-05-31 | -71.78% | $28,216 | -80.97% | -14.16% | $85,839 | -51.51% | -57.62% | no | 52 |
| TSLA buy & hold | 12 | 2023-06-01 | 2024-05-31 | -14.16% | $85,839 | -51.51% | -14.16% | $85,839 | -51.51% | 0.00% | — | — |
| 30D / 20% OTM / 12.5% exposure / Trim 15% every +2000% | 12 | 2023-07-03 | 2024-07-03 | -40.72% | $59,283 | -78.63% | -11.93% | $88,065 | -51.52% | -28.78% | no | 53 |
| 30D / 20% OTM / 12.5% exposure / Trim 25% every +2000% | 12 | 2023-07-03 | 2024-07-03 | -40.72% | $59,283 | -78.63% | -11.93% | $88,065 | -51.52% | -28.78% | no | 53 |
| 30D / 20% OTM / 12.5% exposure / Trim 25% every +3000% | 12 | 2023-07-03 | 2024-07-03 | -40.72% | $59,283 | -78.63% | -11.93% | $88,065 | -51.52% | -28.78% | no | 53 |
| 30D / 20% OTM / 15% exposure / Trim 25% every +2000% | 12 | 2023-07-03 | 2024-07-03 | -55.01% | $44,992 | -84.53% | -11.93% | $88,065 | -51.52% | -43.07% | no | 53 |
| TSLA buy & hold | 12 | 2023-07-03 | 2024-07-03 | -11.93% | $88,065 | -51.52% | -11.93% | $88,065 | -51.52% | 0.00% | — | — |
| 30D / 20% OTM / 12.5% exposure / Trim 15% every +2000% | 12 | 2023-08-01 | 2024-08-01 | -45.30% | $54,703 | -75.61% | -16.93% | $83,068 | -48.54% | -28.37% | no | 53 |
| 30D / 20% OTM / 12.5% exposure / Trim 25% every +2000% | 12 | 2023-08-01 | 2024-08-01 | -45.30% | $54,703 | -75.61% | -16.93% | $83,068 | -48.54% | -28.37% | no | 53 |
| 30D / 20% OTM / 12.5% exposure / Trim 25% every +3000% | 12 | 2023-08-01 | 2024-08-01 | -45.60% | $54,397 | -75.61% | -16.93% | $83,068 | -48.54% | -28.67% | no | 53 |
| 30D / 20% OTM / 15% exposure / Trim 25% every +2000% | 12 | 2023-08-01 | 2024-08-01 | -52.76% | $47,235 | -82.02% | -16.93% | $83,068 | -48.54% | -35.83% | no | 53 |
| TSLA buy & hold | 12 | 2023-08-01 | 2024-08-01 | -16.93% | $83,068 | -48.54% | -16.93% | $83,068 | -48.54% | 0.00% | — | — |
| 30D / 20% OTM / 12.5% exposure / Trim 15% every +2000% | 12 | 2023-11-01 | 2024-11-01 | -23.15% | $76,846 | -69.78% | 21.05% | $121,054 | -45.65% | -44.21% | no | 53 |
| 30D / 20% OTM / 12.5% exposure / Trim 25% every +2000% | 12 | 2023-11-01 | 2024-11-01 | -21.02% | $78,981 | -69.78% | 21.05% | $121,054 | -45.65% | -42.07% | no | 53 |
| 30D / 20% OTM / 12.5% exposure / Trim 25% every +3000% | 12 | 2023-11-01 | 2024-11-01 | -20.30% | $79,702 | -69.78% | 21.05% | $121,054 | -45.65% | -41.35% | no | 53 |
| 30D / 20% OTM / 15% exposure / Trim 25% every +2000% | 12 | 2023-11-01 | 2024-11-01 | -32.13% | $67,868 | -76.71% | 21.05% | $121,054 | -45.65% | -53.19% | no | 53 |
| TSLA buy & hold | 12 | 2023-11-01 | 2024-11-01 | 21.05% | $121,054 | -45.65% | 21.05% | $121,054 | -45.65% | 0.00% | — | — |
Top-Trade Dependency
This is a concentration diagnostic based on the full-period Stage 5 trade ledger. It is intentionally not path-adjusted; it shows how much of the outcome was contributed by the largest completed option cycles.
| Strategy | Final NAV | CAGR | Net option P&L | Cycles | Winning cycles | Top 1 P&L | Top 3 P&L | Top 5 P&L | Top 5 / final NAV | Top 5 / net option P&L | Largest buy | Largest expiry | Largest strike | Largest cycle return |
|---|---|---|---|---|---|---|---|---|---|---|---|---|---|---|
| 30D / 20% OTM / 15% exposure / Trim 25% every +2000% | $312,877,165 | 260.80% | $312,777,165 | 321 | 67 | $117,188,746 | $301,877,636 | $437,882,620 | 139.95% | 140.00% | 2024-10-22 | 2024-11-22 | 260.00 | 3,218.84% |
| 30D / 20% OTM / 12.5% exposure / Trim 25% every +3000% | $284,223,876 | 255.31% | $284,123,876 | 321 | 66 | $95,591,838 | $242,807,420 | $347,042,434 | 122.10% | 122.14% | 2024-10-22 | 2024-11-22 | 260.00 | 3,218.84% |
| 30D / 20% OTM / 12.5% exposure / Trim 15% every +2000% | $305,437,456 | 259.41% | $305,337,456 | 321 | 67 | $102,750,126 | $261,448,277 | $370,504,185 | 121.30% | 121.34% | 2024-10-22 | 2024-11-22 | 260.00 | 3,232.75% |
| 30D / 20% OTM / 12.5% exposure / Trim 25% every +2000% | $305,346,193 | 259.40% | $305,246,193 | 321 | 67 | $102,112,502 | $261,272,339 | $366,483,780 | 120.02% | 120.06% | 2024-10-22 | 2024-11-22 | 260.00 | 3,218.83% |
| TSLA buy & hold | $1,220,188 | 49.01% | — | — | — | — | — | — | — | — | — | — | — | — |
Final Robustness Conclusion
Primary pick: 30D / 20% OTM / 12.5% exposure / Trim 25% every +2000%. This remains the best default if the goal is to maximize compounding while still respecting drawdown and robustness. It is not the highest-final-NAV variant, but it is the cleanest compromise between final NAV, yearly consistency, max drawdown, and concentration risk.
If you value maximum upside most: 30D / 20% OTM / 15% exposure / Trim 25% every +2000%. This is the aggressive choice for a future with repeated strong TSLA trend bursts. It should perform best if TSLA again produces large upside gaps and sustained rallies, but it will likely feel much worse in long declines or sideways periods because more premium is decaying at all times.
If you value lower path risk most: 30D / 20% OTM / 12.5% exposure / Trim 25% every +2000%. This is the defensive finalist. It is better suited to futures that look choppier, more bearish, or more timing-sensitive, but it can lag badly if the biggest TSLA rallies happen while the filter or lower exposure keeps it underinvested.
If you worry about lucky top trades: 30D / 20% OTM / 12.5% exposure / Trim 25% every +2000%. This has the least top-five-cycle dependence in the finalist set. It is the most conservative interpretation of the same 30D / 20% OTM shape, accepting lower final wealth in exchange for less reliance on a few extreme wins.
The practical conclusion is that the report's best strategy is 30D / 20% OTM / 12.5% exposure / Trim 25% every +2000%. The highest-final-NAV finalist is the upside benchmark, the lowest-drawdown finalist is the defensive benchmark, and the lowest-concentration finalist is the robustness benchmark. The primary pick is the one that best sits between those plausible TSLA futures under the report's beat-rate-adjusted drawdown-efficiency selection rule.
Final Picks
These are the distinct finalists named by the final robustness conclusion: the primary balanced pick, maximum-upside pick, lower-drawdown pick, and lowest top-trade-dependence pick. TSLA buy-and-hold is included as the benchmark row.
| Strategy | Dominated by | Take profit | Trend filter | Premium filter | Final NAV | Total return | CAGR | Max DD | Drawdown period | Tesla drawdown in that window | Year wins | Beat rate | Base NAV/DD | Beat-rate adjusted NAV / max DD score | Longest negative period | Negative period | Call return in negative period | TSLA return in negative period | Longest TSLA lag | TSLA lag period | Worst lag vs TSLA | Call return in TSLA lag | TSLA return in TSLA lag | Avg DTE | Avg moneyness | Avg prem/spot | Avg prem pctile | Skipped |
|---|---|---|---|---|---|---|---|---|---|---|---|---|---|---|---|---|---|---|---|---|---|---|---|---|---|---|---|---|
| 30D / 20% OTM / 12.5% exposure / Trim 25% every +2000% | Trim 25% every +2000% | No filter | No premium filter | $305,346,193 | 305,246.19% | 259.40% | -80.60% | 2021-11-04 -> 2023-01-06 | -73.35% | 9 | 81.82% | 3,788,565 | 2,410,905 | 580 | 2021-11-04 -> 2023-06-07 | 7.75% | -45.22% | 380 | 2023-06-21 -> 2024-07-05 | -61.55% | 2.23% | -3.06% | 29.64 | 19.86% | 1.67% | 51.12 | 4 | |
| 30D / 20% OTM / 15% exposure / Trim 25% every +2000% | Trim 25% every +2000% | No filter | No premium filter | $312,877,165 | 312,777.16% | 260.80% | -86.32% | 2021-11-04 -> 2023-01-06 | -73.35% | 9 | 81.82% | 3,624,471 | 2,306,482 | 582 | 2021-11-04 -> 2023-06-09 | 39.00% | -40.39% | 462 | 2021-11-04 -> 2023-02-09 | -64.55% | -44.47% | -49.43% | 29.64 | 19.86% | 1.67% | 51.12 | 4 | |
| TSLA buy & hold | Benchmark | Benchmark | Benchmark | $1,220,188 | 1,120.19% | 49.01% | -73.63% | 2021-11-04 -> 2023-01-03 | -73.63% | — | — | 16,572 | 16,572 | 1,133 | 2021-11-04 -> 2024-12-11 | 3.61% | 3.61% | 0 | 2019-01-02 -> 2019-01-02 | 0.00% | 0.00% | 0.00% | — | — | — | — | — |
How To Execute The Primary Pick
This is the operating checklist for 30D / 20% OTM / 12.5% exposure / Trim 25% every +2000%. The exposure number is premium dollars spent on long calls, not share notional and not delta exposure.
- Keep the core account in cash until each scheduled option buy. Do not buy TSLA shares as part of this call-only strategy unless you are intentionally departing from this report.
- Buy once per week on the chosen weekday. Use the same weekday consistently. If the market is closed, place the buy on the next available trading day.
- Calculate current NAV before buying. NAV is cash plus the current market value of all open option lots.
- Set that week's premium budget to
3.125% of NAV. This comes from the selected12.5%target exposure spread across about4overlapping30Dlots. Do not spend more than this budget just because contracts round awkwardly. - Pick the expiry nearest
30 calendar daysafter the buy date. The expiry must be after the buy date. If two expiries are equally close, use the later expiry. - Pick the strike nearest
20% OTM. Compute target strike as TSLA spot times1.2, then choose the listed strike closest to that target. If two strikes are equally close, use the lower strike. - Buy whole contracts only. Contracts to buy =
floor(min(weekly budget, available cash) / (option mid * 100)). If the result is zero, skip that week's buy. Do not borrow, round up, or top up from outside cash. - Trend filter: none. Do not skip buys because TSLA is below or above a moving average.
- Premium filter: none. Do not reduce or skip because the option looks expensive.
- Take profit: for each separate purchase lot, record its entry premium per share. Each trading day, compare that same contract's current mid to that lot's entry premium. When the mid reaches the next threshold, sell
25%of the contracts still open in that lot, rounded up to at least one contract. This is not 25% of the original lot each time; it is 25% of what remains after prior trims. The thresholds are additive from entry:+2000%,+4000%,+6000%, and so on. Example: if one contract cost$1,000, a+2000%gain means it is worth$21,000, not$2,000. The next thresholds would be$41,000at+4000%and$61,000at+6000%. If the lot started with100contracts, the first trim sells25, leaving75; the next trim sells19, leaving56; the next sells14, leaving42. With fractional contracts it would decay toward zero; with real whole contracts and round-up sizing, the lot eventually reaches zero after enough triggered trims. If several thresholds are already crossed on the same day, process them one at a time until the next threshold is no longer crossed or the lot is fully closed. - At expiry, close or settle the remaining lot. In the model, remaining value equals intrinsic value at expiry. In a real brokerage account, the cleanest execution is to sell-to-close any remaining in-the-money calls before expiry close. If a call is exercised and turns into TSLA shares, sell those shares immediately at the market/spot price; do not keep the shares unless you are intentionally departing from the call-only strategy.
- Use IB for broker bookkeeping, but keep a small execution tracker. You do not need to duplicate the full broker ledger. For each open lot, you only need enough to execute the rule without mistakes: entry premium, contracts still open, and which take-profit thresholds have already been acted on. Also use current account NAV before each weekly buy so the next premium budget is sized correctly.
- Do not improvise. No rolling, averaging down, discretionary skips, extra buys, earlier trims, or thesis-based strike changes. Any such change is a different strategy than the one measured here.
Output Data
CSV outputs are written beside this report as stage1_summary.csv, stage1_equity.csv, stage1_cycles.csv, stage1_yearly_fresh_starts.csv, stage1_frontier_detail.csv, stage1_frontier.csv, stage1_frontier_summary_by_expiry.csv, stage2_summary.csv, stage2_equity.csv, stage2_cycles.csv, stage2_yearly_fresh_starts.csv, stage3_summary.csv, stage3_equity.csv, stage3_cycles.csv, stage3_yearly_fresh_starts.csv, stage4_summary.csv, stage4_equity.csv, stage4_cycles.csv, stage4_yearly_fresh_starts.csv, stage5_summary.csv, stage5_equity.csv, stage5_cycles.csv, stage5_yearly_fresh_starts.csv, stage6_candidates.csv, stage6_rolling_windows.csv, stage6_rolling_summary.csv, stage6_regime_windows.csv, stage6_regime_summary.csv, stage6_worst_start_dates.csv, stage6_top_trade_dependency.csv, and stage1_tsla_buy_hold.csv.