Real-options-only one-call-per-month test. Period: 2019-01-02 to 2025-04-04.
One-Contract Monthly Call Test
Question: Was buying one 25% OTM TSLA call each month profitable by itself?
This deliberately ignores portfolio sizing, margin, and reinvestment. Each cycle buys exactly one listed call from the real historical chain, choosing the strike nearest 125% of TSLA close, holds it to expiry, and records terminal payoff minus premium paid.
Rule
- Buy 1 TSLA call contract per monthly cycle.
- Use the first listed call expiry in the next calendar month.
- Pick the listed call strike nearest 125% of TSLA close on the buy date.
- Use real option mid only:
(open + close) / 2fromdata/real_options.parquet. - No synthetic option prices, no Black-Scholes fallback, no early sale.
Full-Window Summary
Full Trade Ledger (75 Trades)
Every executed monthly call cycle is shown here; the table scrolls both vertically and horizontally.
| # | Buy date | TSLA close | 125% target | Call strike | Actual OTM | Expiry | DTE | Premium/share | Premium/contract | Premium / strike | Premium / spot | Expiry TSLA close | Intrinsic/share | Payoff | ITM | Cycle P&L | Cumulative P&L |
|---|---|---|---|---|---|---|---|---|---|---|---|---|---|---|---|---|---|
| 1 | 2019-01-02 | $21 | $26 | $26 | 25.76% | 2019-02-01 | 30 | $0 | $13 | 0.49% | 0.61% | $21 | $0 | $0 | no | $-13 | $-13 |
| 2 | 2019-02-01 | $21 | $26 | $26 | 24.92% | 2019-03-01 | 28 | $0 | $7 | 0.27% | 0.33% | $20 | $0 | $0 | no | $-7 | $-20 |
| 3 | 2019-03-01 | $20 | $25 | $25 | 25.51% | 2019-04-05 | 35 | $0 | $10 | 0.42% | 0.52% | $18 | $0 | $0 | no | $-10 | $-30 |
| 4 | 2019-04-05 | $18 | $23 | $23 | 25.47% | 2019-05-03 | 28 | $0 | $9 | 0.37% | 0.47% | $17 | $0 | $0 | no | $-9 | $-38 |
| 5 | 2019-05-03 | $17 | $21 | $21 | 25.48% | 2019-06-07 | 35 | $0 | $5 | 0.21% | 0.26% | $14 | $0 | $0 | no | $-5 | $-43 |
| 6 | 2019-06-07 | $14 | $17 | $17 | 24.69% | 2019-07-05 | 28 | $0 | $13 | 0.79% | 0.98% | $16 | $0 | $0 | no | $-13 | $-56 |
| 7 | 2019-07-05 | $16 | $19 | $19 | 24.41% | 2019-08-02 | 28 | $0 | $10 | 0.54% | 0.67% | $16 | $0 | $0 | no | $-10 | $-67 |
| 8 | 2019-08-02 | $16 | $20 | $19 | 23.75% | 2019-09-06 | 35 | $0 | $5 | 0.27% | 0.33% | $15 | $0 | $0 | no | $-5 | $-72 |
| 9 | 2019-09-06 | $15 | $19 | $19 | 25.30% | 2019-10-04 | 28 | $0 | $3 | 0.17% | 0.21% | $15 | $0 | $0 | no | $-3 | $-75 |
| 10 | 2019-10-04 | $15 | $19 | $19 | 25.31% | 2019-11-01 | 28 | $0 | $5 | 0.25% | 0.32% | $21 | $2 | $155 | yes | $151 | $75 |
| 11 | 2019-11-01 | $21 | $26 | $26 | 24.48% | 2019-12-06 | 35 | $0 | $5 | 0.19% | 0.24% | $22 | $0 | $0 | no | $-5 | $70 |
| 12 | 2019-12-06 | $22 | $28 | $28 | 25.04% | 2020-01-03 | 28 | $0 | $2 | 0.07% | 0.09% | $30 | $2 | $153 | yes | $151 | $222 |
| 13 | 2020-01-03 | $30 | $37 | $37 | 24.15% | 2020-02-07 | 35 | $0 | $24 | 0.66% | 0.82% | $50 | $13 | $1,320 | yes | $1,296 | $1,518 |
| 14 | 2020-02-07 | $50 | $62 | $63 | 25.66% | 2020-03-06 | 28 | $2 | $180 | 2.87% | 3.60% | $47 | $0 | $0 | no | $-180 | $1,338 |
| 15 | 2020-03-06 | $47 | $59 | $59 | 25.80% | 2020-04-03 | 28 | $1 | $116 | 1.97% | 2.47% | $32 | $0 | $0 | no | $-116 | $1,222 |
| 16 | 2020-04-03 | $32 | $40 | $40 | 25.00% | 2020-05-01 | 28 | $1 | $109 | 2.71% | 3.39% | $47 | $7 | $675 | yes | $567 | $1,789 |
| 17 | 2020-05-01 | $47 | $58 | $58 | 24.76% | 2020-06-05 | 35 | $1 | $120 | 2.05% | 2.56% | $59 | $1 | $71 | yes | $-49 | $1,740 |
| 18 | 2020-06-05 | $59 | $74 | $73 | 24.20% | 2020-07-02 | 27 | $1 | $53 | 0.72% | 0.89% | $81 | $7 | $724 | yes | $672 | $2,412 |
| 19 | 2020-07-02 | $81 | $101 | $79 | -1.96% | 2020-08-07 | 36 | $8 | $845 | 10.70% | 10.49% | $97 | $18 | $1,785 | yes | $939 | $3,351 |
| 20 | 2020-08-07 | $97 | $121 | $120 | 23.91% | 2020-09-04 | 28 | $1 | $149 | 1.24% | 1.54% | $139 | $19 | $1,944 | yes | $1,795 | $5,146 |
| 21 | 2020-09-04 | $139 | $174 | $173 | 24.31% | 2020-10-02 | 28 | $9 | $923 | 5.32% | 6.62% | $138 | $0 | $0 | no | $-923 | $4,223 |
| 22 | 2020-10-02 | $138 | $173 | $173 | 25.27% | 2020-11-06 | 35 | $6 | $612 | 3.53% | 4.42% | $143 | $0 | $0 | no | $-612 | $3,612 |
| 23 | 2020-11-06 | $143 | $179 | $180 | 25.60% | 2020-12-04 | 28 | $1 | $95 | 0.53% | 0.66% | $200 | $20 | $1,968 | yes | $1,873 | $5,484 |
| 24 | 2020-12-04 | $200 | $250 | $250 | 25.20% | 2021-01-08 | 35 | $6 | $632 | 2.53% | 3.16% | $293 | $43 | $4,334 | yes | $3,702 | $9,187 |
| 25 | 2021-01-08 | $293 | $367 | $367 | 25.00% | 2021-02-05 | 28 | $7 | $736 | 2.01% | 2.51% | $284 | $0 | $0 | no | $-736 | $8,450 |
| 26 | 2021-02-05 | $284 | $355 | $353 | 24.38% | 2021-03-05 | 28 | $2 | $212 | 0.60% | 0.75% | $199 | $0 | $0 | no | $-212 | $8,238 |
| 27 | 2021-03-05 | $199 | $249 | $249 | 25.01% | 2021-04-01 | 27 | $3 | $328 | 1.31% | 1.64% | $221 | $0 | $0 | no | $-328 | $7,911 |
| 28 | 2021-04-01 | $221 | $276 | $277 | 25.43% | 2021-05-07 | 36 | $3 | $322 | 1.17% | 1.46% | $224 | $0 | $0 | no | $-322 | $7,588 |
| 29 | 2021-05-07 | $224 | $280 | $280 | 24.93% | 2021-06-04 | 28 | $1 | $90 | 0.32% | 0.40% | $200 | $0 | $0 | no | $-90 | $7,498 |
| 30 | 2021-06-04 | $200 | $250 | $250 | 25.20% | 2021-07-02 | 28 | $1 | $82 | 0.33% | 0.41% | $226 | $0 | $0 | no | $-82 | $7,416 |
| 31 | 2021-07-02 | $226 | $283 | $283 | 25.20% | 2021-08-06 | 35 | $3 | $265 | 0.94% | 1.17% | $233 | $0 | $0 | no | $-265 | $7,151 |
| 32 | 2021-08-06 | $233 | $291 | $290 | 24.45% | 2021-09-03 | 28 | $1 | $72 | 0.25% | 0.31% | $245 | $0 | $0 | no | $-72 | $7,079 |
| 33 | 2021-09-03 | $245 | $306 | $303 | 24.05% | 2021-10-01 | 28 | $0 | $29 | 0.10% | 0.12% | $258 | $0 | $0 | no | $-29 | $7,050 |
| 34 | 2021-10-01 | $258 | $323 | $323 | 25.13% | 2021-11-05 | 35 | $1 | $84 | 0.26% | 0.33% | $407 | $84 | $8,403 | yes | $8,319 | $15,369 |
| 35 | 2021-11-05 | $407 | $509 | $517 | 26.83% | 2021-12-03 | 28 | $5 | $528 | 1.02% | 1.30% | $338 | $0 | $0 | no | $-528 | $14,841 |
| 36 | 2021-12-03 | $338 | $423 | $423 | 25.13% | 2022-01-07 | 35 | $9 | $899 | 2.12% | 2.66% | $342 | $0 | $0 | no | $-899 | $13,942 |
| 37 | 2022-01-07 | $342 | $428 | $428 | 25.13% | 2022-02-04 | 28 | $5 | $512 | 1.19% | 1.49% | $308 | $0 | $0 | no | $-512 | $13,430 |
| 38 | 2022-02-04 | $308 | $385 | $383 | 24.55% | 2022-03-04 | 28 | $2 | $200 | 0.52% | 0.65% | $279 | $0 | $0 | no | $-200 | $13,230 |
| 39 | 2022-03-04 | $279 | $349 | $350 | 25.25% | 2022-04-01 | 28 | $2 | $198 | 0.57% | 0.71% | $362 | $12 | $1,153 | yes | $955 | $14,185 |
| 40 | 2022-04-01 | $362 | $452 | $450 | 24.47% | 2022-05-06 | 35 | $5 | $457 | 1.01% | 1.26% | $289 | $0 | $0 | no | $-457 | $13,728 |
| 41 | 2022-05-06 | $289 | $361 | $360 | 24.76% | 2022-06-03 | 28 | $3 | $282 | 0.78% | 0.98% | $235 | $0 | $0 | no | $-282 | $13,447 |
| 42 | 2022-06-03 | $235 | $293 | $293 | 25.08% | 2022-07-01 | 28 | $3 | $344 | 1.17% | 1.47% | $227 | $0 | $0 | no | $-344 | $13,103 |
| 43 | 2022-07-01 | $227 | $284 | $283 | 24.67% | 2022-08-05 | 35 | $4 | $358 | 1.26% | 1.58% | $288 | $5 | $484 | yes | $125 | $13,228 |
| 44 | 2022-08-05 | $288 | $360 | $360 | 24.93% | 2022-09-02 | 28 | $2 | $239 | 0.66% | 0.83% | $270 | $0 | $0 | no | $-239 | $12,989 |
| 45 | 2022-09-02 | $270 | $338 | $340 | 25.83% | 2022-10-07 | 35 | $2 | $186 | 0.55% | 0.69% | $223 | $0 | $0 | no | $-186 | $12,803 |
| 46 | 2022-10-07 | $223 | $279 | $280 | 25.52% | 2022-11-04 | 28 | $3 | $265 | 0.95% | 1.19% | $207 | $0 | $0 | no | $-265 | $12,538 |
| 47 | 2022-11-04 | $207 | $259 | $260 | 25.32% | 2022-12-02 | 28 | $2 | $164 | 0.63% | 0.79% | $195 | $0 | $0 | no | $-164 | $12,374 |
| 48 | 2022-12-02 | $195 | $244 | $245 | 25.73% | 2023-01-06 | 35 | $2 | $157 | 0.64% | 0.81% | $113 | $0 | $0 | no | $-157 | $12,217 |
| 49 | 2023-01-06 | $113 | $141 | $140 | 23.83% | 2023-02-03 | 28 | $2 | $174 | 1.24% | 1.53% | $190 | $50 | $4,998 | yes | $4,824 | $17,041 |
| 50 | 2023-02-03 | $190 | $237 | $235 | 23.70% | 2023-03-03 | 28 | $3 | $324 | 1.38% | 1.71% | $198 | $0 | $0 | no | $-324 | $16,717 |
| 51 | 2023-03-03 | $198 | $247 | $245 | 23.87% | 2023-04-06 | 34 | $2 | $237 | 0.97% | 1.20% | $185 | $0 | $0 | no | $-237 | $16,481 |
| 52 | 2023-04-06 | $185 | $231 | $230 | 24.28% | 2023-05-05 | 29 | $2 | $158 | 0.69% | 0.86% | $170 | $0 | $0 | no | $-158 | $16,322 |
| 53 | 2023-05-05 | $170 | $213 | $215 | 26.43% | 2023-06-02 | 28 | $0 | $27 | 0.13% | 0.16% | $214 | $0 | $0 | no | $-27 | $16,295 |
| 54 | 2023-06-02 | $214 | $267 | $265 | 23.85% | 2023-07-07 | 35 | $2 | $217 | 0.82% | 1.02% | $274 | $9 | $943 | yes | $725 | $17,021 |
| 55 | 2023-07-07 | $274 | $343 | $345 | 25.72% | 2023-08-04 | 28 | $2 | $244 | 0.71% | 0.89% | $254 | $0 | $0 | no | $-244 | $16,777 |
| 56 | 2023-08-04 | $254 | $317 | $315 | 24.08% | 2023-09-01 | 28 | $1 | $110 | 0.35% | 0.43% | $245 | $0 | $0 | no | $-110 | $16,667 |
| 57 | 2023-09-01 | $245 | $306 | $305 | 24.48% | 2023-10-06 | 35 | $3 | $250 | 0.82% | 1.02% | $261 | $0 | $0 | no | $-250 | $16,417 |
| 58 | 2023-10-06 | $261 | $326 | $325 | 24.75% | 2023-11-03 | 28 | $1 | $107 | 0.33% | 0.41% | $220 | $0 | $0 | no | $-107 | $16,310 |
| 59 | 2023-11-03 | $220 | $275 | $275 | 25.02% | 2023-12-01 | 28 | $1 | $64 | 0.23% | 0.29% | $239 | $0 | $0 | no | $-64 | $16,246 |
| 60 | 2023-12-01 | $239 | $299 | $300 | 25.61% | 2024-01-05 | 35 | $1 | $103 | 0.34% | 0.43% | $237 | $0 | $0 | no | $-103 | $16,143 |
| 61 | 2024-01-05 | $237 | $297 | $295 | 24.22% | 2024-02-02 | 28 | $1 | $110 | 0.37% | 0.46% | $188 | $0 | $0 | no | $-110 | $16,033 |
| 62 | 2024-02-02 | $188 | $235 | $235 | 25.06% | 2024-03-01 | 28 | $0 | $40 | 0.17% | 0.21% | $203 | $0 | $0 | no | $-40 | $15,993 |
| 63 | 2024-03-01 | $203 | $253 | $255 | 25.84% | 2024-04-05 | 35 | $1 | $82 | 0.32% | 0.41% | $165 | $0 | $0 | no | $-82 | $15,910 |
| 64 | 2024-04-05 | $165 | $206 | $205 | 24.32% | 2024-05-03 | 28 | $1 | $142 | 0.69% | 0.86% | $181 | $0 | $0 | no | $-142 | $15,769 |
| 65 | 2024-05-03 | $181 | $226 | $225 | 24.18% | 2024-06-07 | 35 | $1 | $101 | 0.45% | 0.56% | $177 | $0 | $0 | no | $-101 | $15,667 |
| 66 | 2024-06-07 | $177 | $222 | $220 | 23.96% | 2024-07-05 | 28 | $1 | $94 | 0.43% | 0.53% | $252 | $32 | $3,152 | yes | $3,058 | $18,725 |
| 67 | 2024-07-05 | $252 | $314 | $315 | 25.24% | 2024-08-02 | 28 | $4 | $418 | 1.33% | 1.66% | $208 | $0 | $0 | no | $-418 | $18,307 |
| 68 | 2024-08-02 | $208 | $260 | $260 | 25.20% | 2024-09-06 | 35 | $2 | $190 | 0.73% | 0.92% | $211 | $0 | $0 | no | $-190 | $18,117 |
| 69 | 2024-09-06 | $211 | $263 | $265 | 25.75% | 2024-10-04 | 28 | $3 | $314 | 1.18% | 1.49% | $250 | $0 | $0 | no | $-314 | $17,803 |
| 70 | 2024-10-04 | $250 | $313 | $315 | 25.96% | 2024-11-01 | 28 | $3 | $318 | 1.01% | 1.27% | $249 | $0 | $0 | no | $-318 | $17,486 |
| 71 | 2024-11-01 | $249 | $311 | $310 | 24.51% | 2024-12-06 | 35 | $2 | $208 | 0.67% | 0.84% | $389 | $79 | $7,922 | yes | $7,714 | $25,200 |
| 72 | 2024-12-06 | $389 | $487 | $485 | 24.61% | 2025-01-03 | 28 | $3 | $350 | 0.72% | 0.90% | $410 | $0 | $0 | no | $-350 | $24,850 |
| 73 | 2025-01-03 | $410 | $513 | $515 | 25.48% | 2025-02-07 | 35 | $6 | $642 | 1.25% | 1.56% | $362 | $0 | $0 | no | $-642 | $24,208 |
| 74 | 2025-02-07 | $362 | $452 | $450 | 24.44% | 2025-03-07 | 28 | $3 | $270 | 0.60% | 0.75% | $263 | $0 | $0 | no | $-270 | $23,939 |
| 75 | 2025-03-07 | $263 | $328 | $330 | 25.63% | 2025-04-04 | 28 | $3 | $301 | 0.91% | 1.15% | $239 | $0 | $0 | no | $-301 | $23,637 |
Output Data
The one-contract trade ledger is written beside this report as monthly_call_trades.csv.
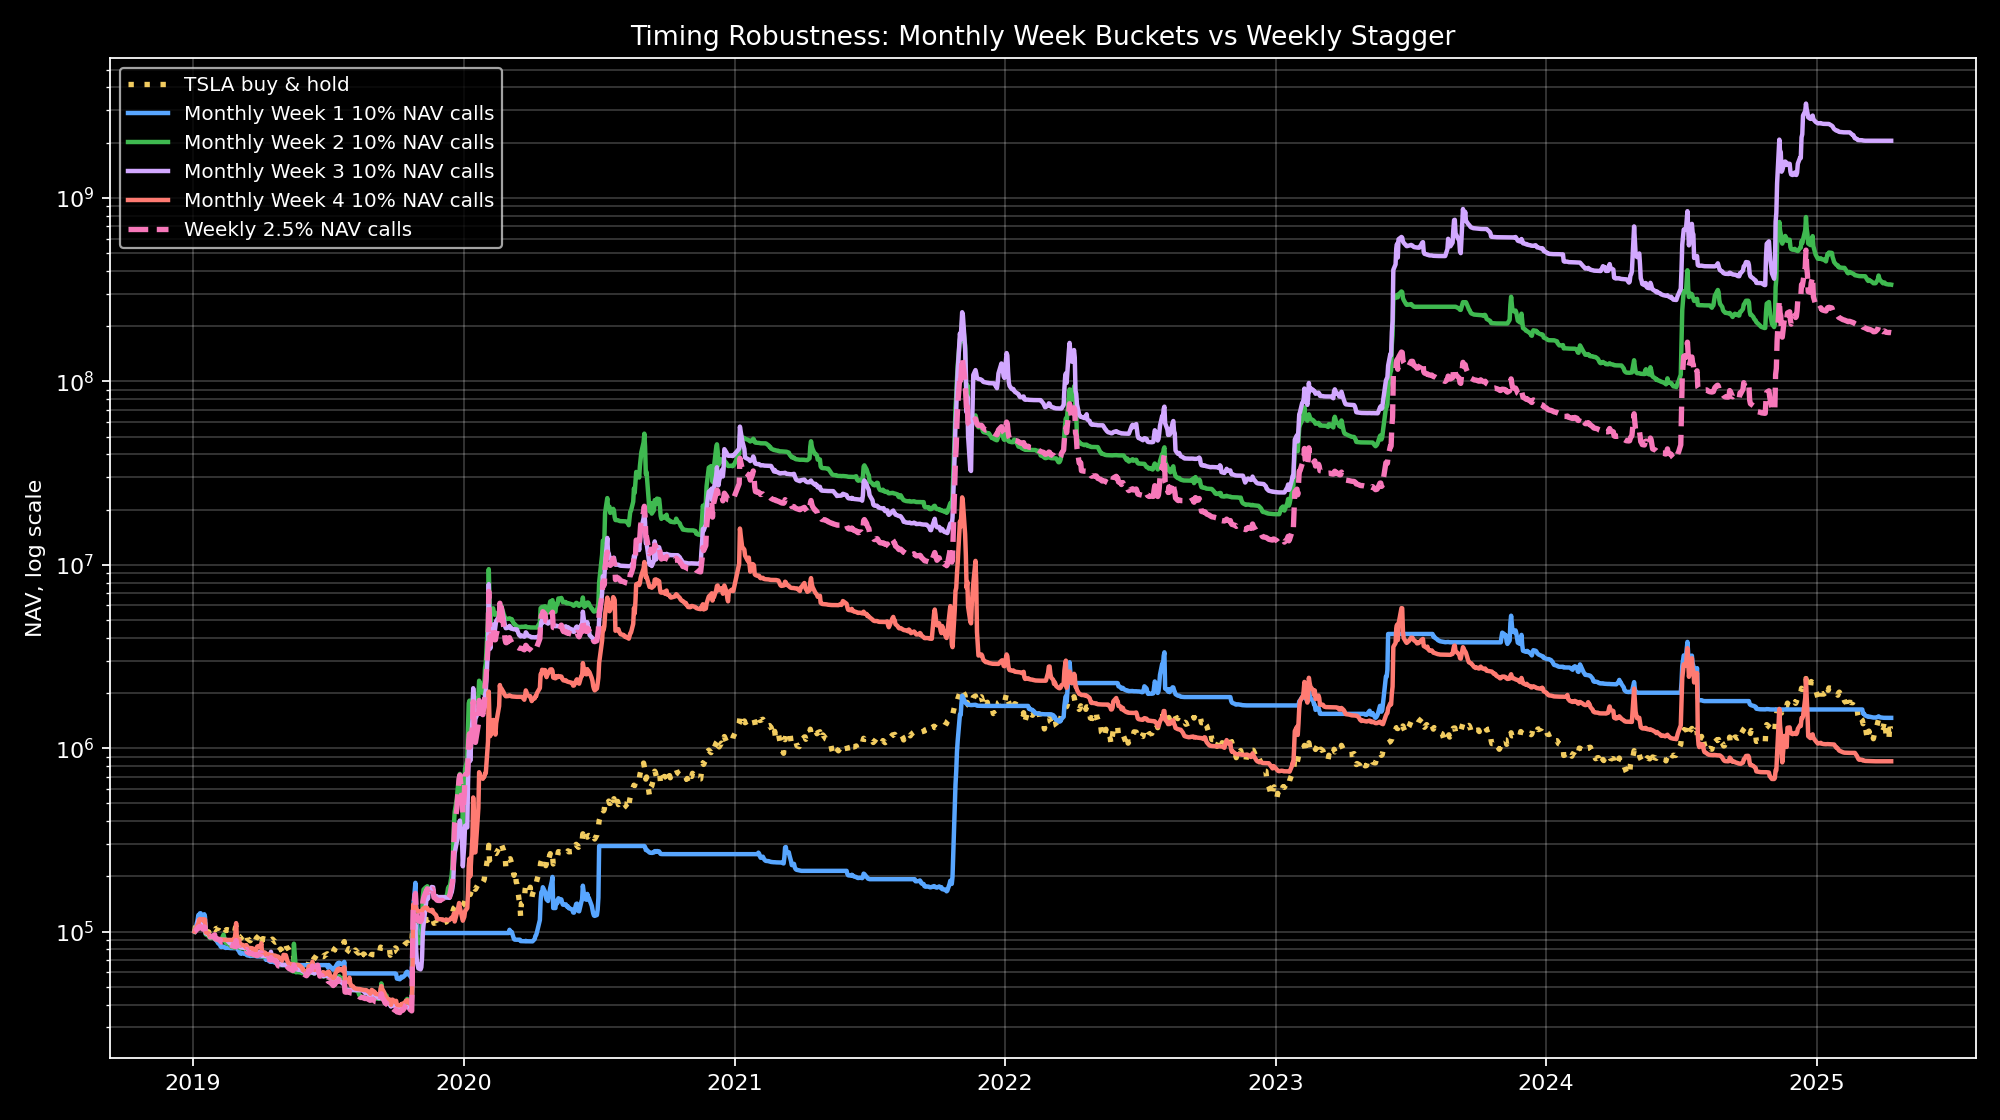
Options-Only 10% NAV Calls vs TSLA Hold
Question: Does the 10% NAV options-only call strategy work versus TSLA hold, and is the result robust across calendar timing?
This section restarts every line at $100,000 on 2019-01-03 and compares TSLA hold, four monthly week-of-month 10% NAV call rolls, and the weekly 2.5% NAV stagger. Testing the monthly rule across four timing slots answers whether one entry week got unusually lucky. Monthly buckets choose the first available expiry in the selected Monday-Sunday calendar week of the target month. Contract count is floored to stay at or below the target budget, with no margin and no negative cash.
10% NAV Timing Comparison
10% NAV Timing Summary
| Strategy | Initial NAV | Final NAV | Total return | CAGR | Max drawdown | DD peak | DD trough | Cycles | Win rate | Premium paid | Expiry payoff | Skipped |
|---|---|---|---|---|---|---|---|---|---|---|---|---|
| TSLA buy & hold | $100,000 | $1,260,036 | 1,160.04% | 49.80% | -73.63% | 2021-11-04 | 2023-01-03 | 0 | 0.00% | $0 | $0 | 0 |
| Monthly Week 1 10% NAV calls | $100,000 | $1,462,519 | 1,362.52% | 53.40% | -72.26% | 2023-11-15 | 2025-04-04 | 35 | 20.00% | $4,623,413 | $5,985,932 | 21 |
| Monthly Week 2 10% NAV calls | $100,000 | $336,482,410 | 336,382.41% | 265.21% | -91.27% | 2021-11-04 | 2023-01-06 | 73 | 19.18% | $652,887,988 | $989,270,398 | 2 |
| Monthly Week 3 10% NAV calls | $100,000 | $2,048,852,945 | 2,048,752.94% | 387.17% | -89.59% | 2021-11-04 | 2023-01-13 | 74 | 18.92% | $1,870,186,315 | $3,918,939,260 | 1 |
| Monthly Week 4 10% NAV calls | $100,000 | $847,916 | 747.92% | 40.63% | -97.09% | 2021-11-04 | 2024-11-04 | 74 | 14.86% | $18,029,755 | $18,777,671 | 1 |
| Weekly 2.5% NAV calls | $100,000 | $184,184,945 | 184,084.95% | 231.74% | -90.23% | 2021-11-04 | 2023-01-06 | 321 | 17.76% | $362,584,694 | $546,669,639 | 4 |
10% NAV Timing Output Data
The robustness CSV outputs are written beside this report as options_only_call_timing_robustness_equity.csv, options_only_call_timing_robustness_summary.csv, and options_only_call_timing_robustness_cycles.csv.
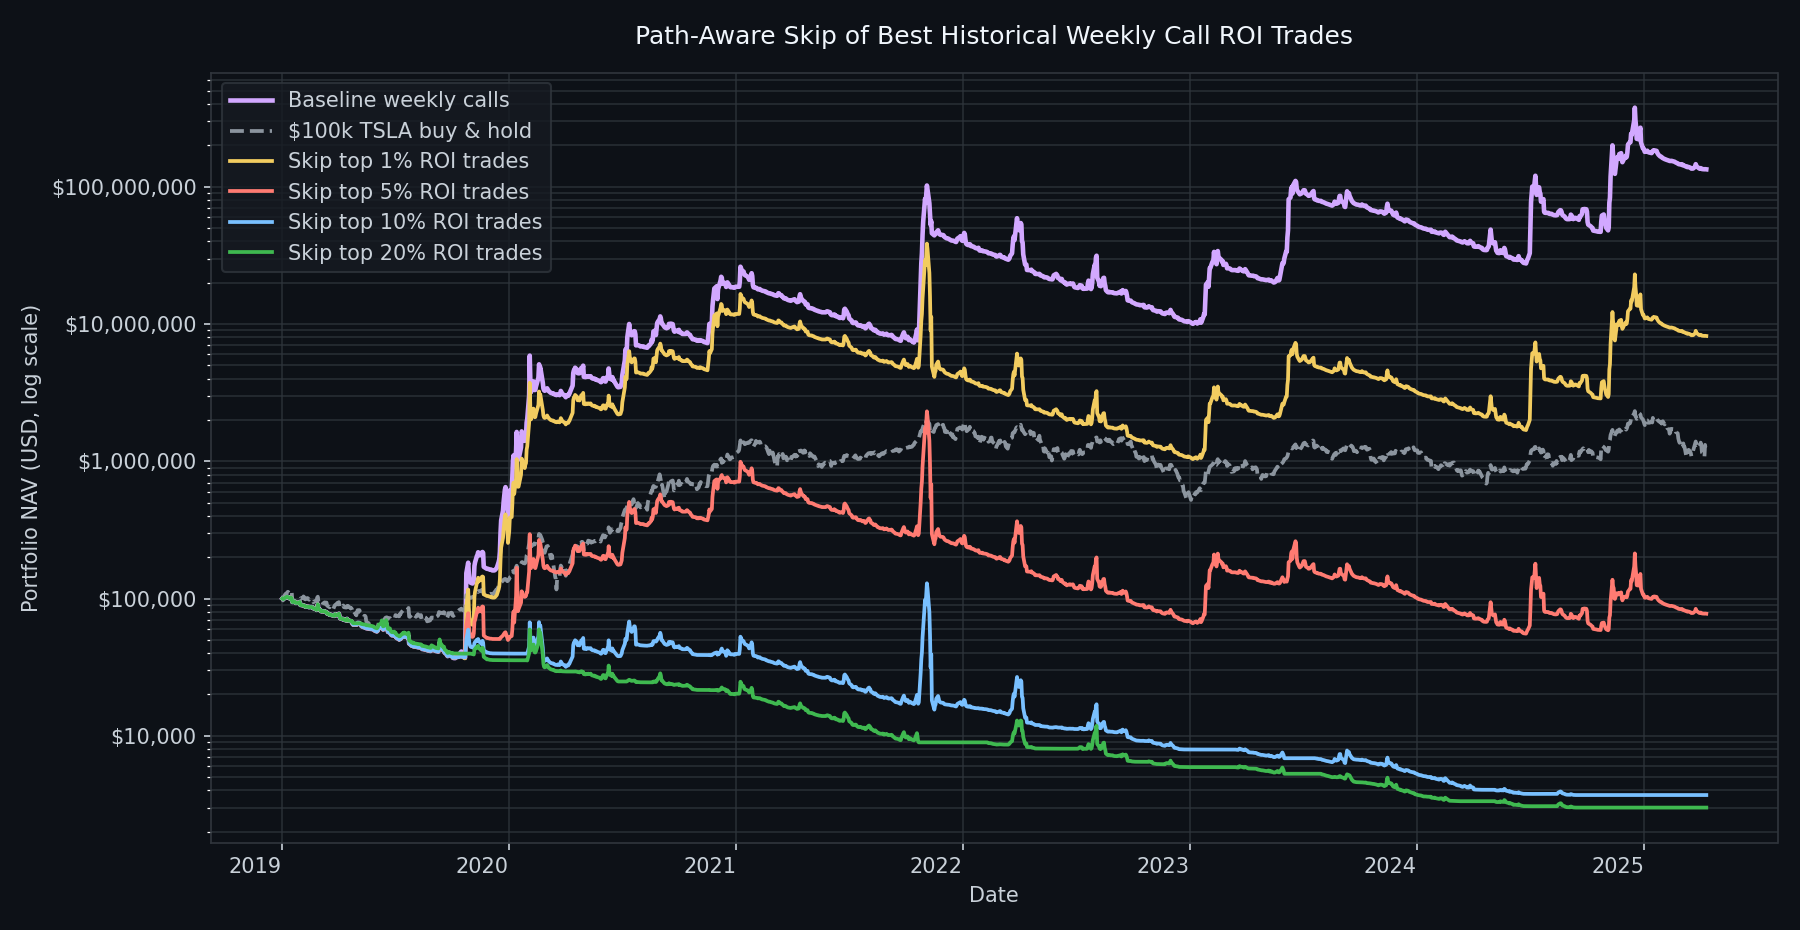
Outlier Dependence: Path-Aware Winner Skip Test
Question: How much of the weekly call strategy depends on the best historical call winners?
This is an oracle stress test, not a tradable rule. It first ranks the baseline weekly call entries by return on premium, then re-runs the strategy from the beginning while skipping the best 1%, 5%, 10%, and 20% of those historical ROI winners. Skipped entries keep cash in the account, and every later entry sizes from the lower path-aware NAV.
Oracle Skip Comparison
Oracle Skip Summary
| Variant | Oracle skips | Final NAV | Vs baseline | Vs baseline % | CAGR | Max drawdown | Win rate | Premium paid | Expiry payoff | Total skipped |
|---|---|---|---|---|---|---|---|---|---|---|
| Baseline weekly calls | 0 | $133,913,421 | $0 | 0.00% | 215.14% | -90.18% | 16.83% | $266,645,804 | $400,459,225 | 10 |
| Skip top 1% ROI trades | 4 | $8,181,255 | -$125,732,165 | -93.89% | 101.82% | -97.31% | 15.76% | $31,765,614 | $39,846,870 | 14 |
| Skip top 5% ROI trades | 16 | $77,525 | -$133,835,896 | -99.94% | -3.98% | -97.60% | 12.37% | $1,544,658 | $1,522,183 | 26 |
| Skip top 10% ROI trades | 32 | $3,703 | -$133,909,718 | -100.00% | -40.87% | -97.13% | 5.74% | $148,507 | $52,210 | 116 |
| Skip top 20% ROI trades | 63 | $3,000 | -$133,910,421 | -100.00% | -42.83% | -97.08% | 0.00% | $97,000 | $0 | 172 |
Baseline Trades Skipped by Each Oracle Variant
ROI on premium is cycle P&L / premium paid. The same high-ROI baseline trade can appear in multiple rows because the 5%, 10%, and 20% variants include the smaller skip sets.
| Variant | Buy date | Expiry | Buy TSLA close | Call strike | Premium paid | Expiry payoff | Cycle P&L | ROI on premium |
|---|---|---|---|---|---|---|---|---|
| Skip top 1% ROI trades | 2021-10-07 | 2021-11-05 | $264.54 | $333.33 | $194,169 | $24,363,276 | $24,169,107 | 12,447.46% |
| Skip top 1% ROI trades | 2021-09-30 | 2021-10-29 | $258.49 | $323.33 | $201,218 | $15,662,403 | $15,461,185 | 7,683.79% |
| Skip top 1% ROI trades | 2023-05-19 | 2023-06-16 | $180.14 | $226.67 | $510,328 | $37,988,602 | $37,478,274 | 7,343.96% |
| Skip top 1% ROI trades | 2019-09-25 | 2019-10-25 | $15.25 | $19.33 | $951 | $65,329 | $64,379 | 6,770.27% |
| Skip top 5% ROI trades | 2021-10-07 | 2021-11-05 | $264.54 | $333.33 | $194,169 | $24,363,276 | $24,169,107 | 12,447.46% |
| Skip top 5% ROI trades | 2021-09-30 | 2021-10-29 | $258.49 | $323.33 | $201,218 | $15,662,403 | $15,461,185 | 7,683.79% |
| Skip top 5% ROI trades | 2023-05-19 | 2023-06-16 | $180.14 | $226.67 | $510,328 | $37,988,602 | $37,478,274 | 7,343.96% |
| Skip top 5% ROI trades | 2019-09-25 | 2019-10-25 | $15.25 | $19.33 | $951 | $65,329 | $64,379 | 6,770.27% |
| Skip top 5% ROI trades | 2019-12-11 | 2020-01-10 | $23.51 | $30.00 | $4,074 | $234,020 | $229,947 | 5,644.90% |
| Skip top 5% ROI trades | 2020-01-02 | 2020-01-31 | $28.68 | $36.00 | $12,152 | $675,214 | $663,062 | 5,456.28% |
| Skip top 5% ROI trades | 2024-10-22 | 2024-11-22 | $217.97 | $275.00 | $1,172,259 | $61,225,862 | $60,053,603 | 5,122.90% |
| Skip top 5% ROI trades | 2023-05-12 | 2023-06-09 | $167.98 | $210.00 | $520,014 | $27,103,755 | $26,583,741 | 5,112.12% |
| Skip top 5% ROI trades | 2019-11-27 | 2019-12-27 | $22.09 | $27.67 | $4,115 | $207,527 | $203,412 | 4,942.62% |
| Skip top 5% ROI trades | 2019-12-04 | 2020-01-03 | $22.20 | $28.67 | $4,064 | $182,314 | $178,250 | 4,386.21% |
| Skip top 5% ROI trades | 2024-06-04 | 2024-07-05 | $174.77 | $220.00 | $743,760 | $26,048,132 | $25,304,372 | 3,402.22% |
| Skip top 5% ROI trades | 2024-11-05 | 2024-12-06 | $251.44 | $315.00 | $1,259,488 | $43,990,195 | $42,730,707 | 3,392.71% |
| Skip top 5% ROI trades | 2019-10-09 | 2019-11-08 | $16.30 | $20.67 | $933 | $28,768 | $27,836 | 2,984.09% |
| Skip top 5% ROI trades | 2019-10-16 | 2019-11-15 | $17.32 | $21.67 | $1,015 | $30,974 | $29,959 | 2,952.81% |
| Skip top 5% ROI trades | 2020-11-12 | 2020-12-11 | $137.25 | $173.33 | $184,146 | $5,075,436 | $4,891,290 | 2,656.20% |
| Skip top 5% ROI trades | 2020-01-16 | 2020-02-14 | $34.23 | $43.00 | $25,686 | $648,025 | $622,339 | 2,422.86% |
| Skip top 10% ROI trades | 2021-10-07 | 2021-11-05 | $264.54 | $333.33 | $194,169 | $24,363,276 | $24,169,107 | 12,447.46% |
| Skip top 10% ROI trades | 2021-09-30 | 2021-10-29 | $258.49 | $323.33 | $201,218 | $15,662,403 | $15,461,185 | 7,683.79% |
| Skip top 10% ROI trades | 2023-05-19 | 2023-06-16 | $180.14 | $226.67 | $510,328 | $37,988,602 | $37,478,274 | 7,343.96% |
| Skip top 10% ROI trades | 2019-09-25 | 2019-10-25 | $15.25 | $19.33 | $951 | $65,329 | $64,379 | 6,770.27% |
| Skip top 10% ROI trades | 2019-12-11 | 2020-01-10 | $23.51 | $30.00 | $4,074 | $234,020 | $229,947 | 5,644.90% |
| Skip top 10% ROI trades | 2020-01-02 | 2020-01-31 | $28.68 | $36.00 | $12,152 | $675,214 | $663,062 | 5,456.28% |
| Skip top 10% ROI trades | 2024-10-22 | 2024-11-22 | $217.97 | $275.00 | $1,172,259 | $61,225,862 | $60,053,603 | 5,122.90% |
| Skip top 10% ROI trades | 2023-05-12 | 2023-06-09 | $167.98 | $210.00 | $520,014 | $27,103,755 | $26,583,741 | 5,112.12% |
| Skip top 10% ROI trades | 2019-11-27 | 2019-12-27 | $22.09 | $27.67 | $4,115 | $207,527 | $203,412 | 4,942.62% |
| Skip top 10% ROI trades | 2019-12-04 | 2020-01-03 | $22.20 | $28.67 | $4,064 | $182,314 | $178,250 | 4,386.21% |
| Skip top 10% ROI trades | 2024-06-04 | 2024-07-05 | $174.77 | $220.00 | $743,760 | $26,048,132 | $25,304,372 | 3,402.22% |
| Skip top 10% ROI trades | 2024-11-05 | 2024-12-06 | $251.44 | $315.00 | $1,259,488 | $43,990,195 | $42,730,707 | 3,392.71% |
| Skip top 10% ROI trades | 2019-10-09 | 2019-11-08 | $16.30 | $20.67 | $933 | $28,768 | $27,836 | 2,984.09% |
| Skip top 10% ROI trades | 2019-10-16 | 2019-11-15 | $17.32 | $21.67 | $1,015 | $30,974 | $29,959 | 2,952.81% |
| Skip top 10% ROI trades | 2020-11-12 | 2020-12-11 | $137.25 | $173.33 | $184,146 | $5,075,436 | $4,891,290 | 2,656.20% |
| Skip top 10% ROI trades | 2020-01-16 | 2020-02-14 | $34.23 | $43.00 | $25,686 | $648,025 | $622,339 | 2,422.86% |
| Skip top 10% ROI trades | 2024-06-11 | 2024-07-12 | $170.66 | $215.00 | $732,114 | $18,223,330 | $17,491,216 | 2,389.14% |
| Skip top 10% ROI trades | 2019-12-18 | 2020-01-17 | $26.21 | $33.00 | $5,473 | $134,643 | $129,171 | 2,360.32% |
| Skip top 10% ROI trades | 2024-10-15 | 2024-11-15 | $219.57 | $275.00 | $1,188,978 | $27,948,637 | $26,759,658 | 2,250.64% |
| Skip top 10% ROI trades | 2023-01-17 | 2023-02-17 | $131.49 | $165.00 | $262,094 | $5,881,498 | $5,619,404 | 2,144.04% |
| Skip top 10% ROI trades | 2020-10-29 | 2020-11-27 | $136.94 | $171.67 | $191,360 | $3,679,519 | $3,488,159 | 1,822.83% |
| Skip top 10% ROI trades | 2023-01-10 | 2023-02-10 | $118.85 | $150.00 | $256,114 | $4,871,871 | $4,615,757 | 1,802.23% |
| Skip top 10% ROI trades | 2020-01-09 | 2020-02-07 | $32.09 | $40.33 | $27,563 | $518,867 | $491,305 | 1,782.50% |
| Skip top 10% ROI trades | 2020-01-23 | 2020-02-21 | $38.15 | $48.00 | $40,166 | $721,587 | $681,421 | 1,696.53% |
| Skip top 10% ROI trades | 2023-05-26 | 2023-06-23 | $193.17 | $245.00 | $552,178 | $9,350,765 | $8,798,586 | 1,593.43% |
| Skip top 10% ROI trades | 2020-11-05 | 2020-12-04 | $146.03 | $183.33 | $190,570 | $3,167,983 | $2,977,413 | 1,562.37% |
| Skip top 10% ROI trades | 2019-12-26 | 2020-01-24 | $28.73 | $36.00 | $15,477 | $243,898 | $228,421 | 1,475.87% |
| Skip top 10% ROI trades | 2020-07-30 | 2020-08-28 | $99.17 | $126.00 | $173,031 | $2,669,128 | $2,496,097 | 1,442.57% |
| Skip top 10% ROI trades | 2019-10-23 | 2019-11-22 | $16.98 | $21.33 | $923 | $14,083 | $13,160 | 1,425.15% |
| Skip top 10% ROI trades | 2023-01-03 | 2023-02-03 | $108.10 | $140.00 | $256,178 | $3,833,466 | $3,577,288 | 1,396.41% |
| Skip top 10% ROI trades | 2020-06-11 | 2020-07-10 | $64.86 | $81.33 | $107,433 | $1,545,334 | $1,437,901 | 1,338.41% |
| Skip top 10% ROI trades | 2020-06-18 | 2020-07-17 | $66.93 | $84.00 | $97,888 | $1,403,294 | $1,305,406 | 1,333.57% |
| Skip top 20% ROI trades | 2021-10-07 | 2021-11-05 | $264.54 | $333.33 | $194,169 | $24,363,276 | $24,169,107 | 12,447.46% |
| Skip top 20% ROI trades | 2021-09-30 | 2021-10-29 | $258.49 | $323.33 | $201,218 | $15,662,403 | $15,461,185 | 7,683.79% |
| Skip top 20% ROI trades | 2023-05-19 | 2023-06-16 | $180.14 | $226.67 | $510,328 | $37,988,602 | $37,478,274 | 7,343.96% |
| Skip top 20% ROI trades | 2019-09-25 | 2019-10-25 | $15.25 | $19.33 | $951 | $65,329 | $64,379 | 6,770.27% |
| Skip top 20% ROI trades | 2019-12-11 | 2020-01-10 | $23.51 | $30.00 | $4,074 | $234,020 | $229,947 | 5,644.90% |
| Skip top 20% ROI trades | 2020-01-02 | 2020-01-31 | $28.68 | $36.00 | $12,152 | $675,214 | $663,062 | 5,456.28% |
| Skip top 20% ROI trades | 2024-10-22 | 2024-11-22 | $217.97 | $275.00 | $1,172,259 | $61,225,862 | $60,053,603 | 5,122.90% |
| Skip top 20% ROI trades | 2023-05-12 | 2023-06-09 | $167.98 | $210.00 | $520,014 | $27,103,755 | $26,583,741 | 5,112.12% |
| Skip top 20% ROI trades | 2019-11-27 | 2019-12-27 | $22.09 | $27.67 | $4,115 | $207,527 | $203,412 | 4,942.62% |
| Skip top 20% ROI trades | 2019-12-04 | 2020-01-03 | $22.20 | $28.67 | $4,064 | $182,314 | $178,250 | 4,386.21% |
| Skip top 20% ROI trades | 2024-06-04 | 2024-07-05 | $174.77 | $220.00 | $743,760 | $26,048,132 | $25,304,372 | 3,402.22% |
| Skip top 20% ROI trades | 2024-11-05 | 2024-12-06 | $251.44 | $315.00 | $1,259,488 | $43,990,195 | $42,730,707 | 3,392.71% |
| Skip top 20% ROI trades | 2019-10-09 | 2019-11-08 | $16.30 | $20.67 | $933 | $28,768 | $27,836 | 2,984.09% |
| Skip top 20% ROI trades | 2019-10-16 | 2019-11-15 | $17.32 | $21.67 | $1,015 | $30,974 | $29,959 | 2,952.81% |
| Skip top 20% ROI trades | 2020-11-12 | 2020-12-11 | $137.25 | $173.33 | $184,146 | $5,075,436 | $4,891,290 | 2,656.20% |
| Skip top 20% ROI trades | 2020-01-16 | 2020-02-14 | $34.23 | $43.00 | $25,686 | $648,025 | $622,339 | 2,422.86% |
| Skip top 20% ROI trades | 2024-06-11 | 2024-07-12 | $170.66 | $215.00 | $732,114 | $18,223,330 | $17,491,216 | 2,389.14% |
| Skip top 20% ROI trades | 2019-12-18 | 2020-01-17 | $26.21 | $33.00 | $5,473 | $134,643 | $129,171 | 2,360.32% |
| Skip top 20% ROI trades | 2024-10-15 | 2024-11-15 | $219.57 | $275.00 | $1,188,978 | $27,948,637 | $26,759,658 | 2,250.64% |
| Skip top 20% ROI trades | 2023-01-17 | 2023-02-17 | $131.49 | $165.00 | $262,094 | $5,881,498 | $5,619,404 | 2,144.04% |
| Skip top 20% ROI trades | 2020-10-29 | 2020-11-27 | $136.94 | $171.67 | $191,360 | $3,679,519 | $3,488,159 | 1,822.83% |
| Skip top 20% ROI trades | 2023-01-10 | 2023-02-10 | $118.85 | $150.00 | $256,114 | $4,871,871 | $4,615,757 | 1,802.23% |
| Skip top 20% ROI trades | 2020-01-09 | 2020-02-07 | $32.09 | $40.33 | $27,563 | $518,867 | $491,305 | 1,782.50% |
| Skip top 20% ROI trades | 2020-01-23 | 2020-02-21 | $38.15 | $48.00 | $40,166 | $721,587 | $681,421 | 1,696.53% |
| Skip top 20% ROI trades | 2023-05-26 | 2023-06-23 | $193.17 | $245.00 | $552,178 | $9,350,765 | $8,798,586 | 1,593.43% |
| Skip top 20% ROI trades | 2020-11-05 | 2020-12-04 | $146.03 | $183.33 | $190,570 | $3,167,983 | $2,977,413 | 1,562.37% |
| Skip top 20% ROI trades | 2019-12-26 | 2020-01-24 | $28.73 | $36.00 | $15,477 | $243,898 | $228,421 | 1,475.87% |
| Skip top 20% ROI trades | 2020-07-30 | 2020-08-28 | $99.17 | $126.00 | $173,031 | $2,669,128 | $2,496,097 | 1,442.57% |
| Skip top 20% ROI trades | 2019-10-23 | 2019-11-22 | $16.98 | $21.33 | $923 | $14,083 | $13,160 | 1,425.15% |
| Skip top 20% ROI trades | 2023-01-03 | 2023-02-03 | $108.10 | $140.00 | $256,178 | $3,833,466 | $3,577,288 | 1,396.41% |
| Skip top 20% ROI trades | 2020-06-11 | 2020-07-10 | $64.86 | $81.33 | $107,433 | $1,545,334 | $1,437,901 | 1,338.41% |
| Skip top 20% ROI trades | 2020-06-18 | 2020-07-17 | $66.93 | $84.00 | $97,888 | $1,403,294 | $1,305,406 | 1,333.57% |
| Skip top 20% ROI trades | 2020-06-25 | 2020-07-24 | $65.73 | $82.67 | $86,538 | $1,167,020 | $1,080,483 | 1,248.57% |
| Skip top 20% ROI trades | 2020-03-19 | 2020-04-17 | $28.51 | $35.67 | $76,128 | $809,893 | $733,766 | 963.86% |
| Skip top 20% ROI trades | 2024-10-29 | 2024-11-29 | $259.52 | $325.00 | $1,451,400 | $14,273,283 | $12,821,883 | 883.41% |
| Skip top 20% ROI trades | 2022-12-27 | 2023-01-27 | $109.10 | $140.00 | $259,772 | $2,436,970 | $2,177,198 | 838.12% |
| Skip top 20% ROI trades | 2021-10-21 | 2021-11-19 | $298.00 | $375.00 | $190,025 | $1,666,687 | $1,476,662 | 777.09% |
| Skip top 20% ROI trades | 2023-01-24 | 2023-02-24 | $143.89 | $180.00 | $296,217 | $2,415,529 | $2,119,312 | 715.46% |
| Skip top 20% ROI trades | 2019-10-02 | 2019-11-01 | $16.21 | $20.33 | $986 | $8,033 | $7,047 | 714.71% |
| Skip top 20% ROI trades | 2020-04-02 | 2020-05-01 | $30.30 | $38.33 | $73,100 | $572,651 | $499,551 | 683.38% |
| Skip top 20% ROI trades | 2023-08-18 | 2023-09-15 | $215.49 | $270.00 | $1,821,169 | $12,022,494 | $10,201,325 | 560.15% |
| Skip top 20% ROI trades | 2021-10-14 | 2021-11-12 | $272.77 | $341.67 | $183,040 | $1,185,534 | $1,002,494 | 547.69% |
| Skip top 20% ROI trades | 2020-11-19 | 2020-12-18 | $166.42 | $210.00 | $250,344 | $1,586,000 | $1,335,656 | 533.53% |
| Skip top 20% ROI trades | 2020-12-11 | 2021-01-08 | $203.33 | $266.67 | $500,153 | $2,011,169 | $1,511,016 | 302.11% |
| Skip top 20% ROI trades | 2024-06-18 | 2024-07-19 | $184.86 | $235.00 | $729,440 | $2,607,358 | $1,877,918 | 257.45% |
| Skip top 20% ROI trades | 2024-11-12 | 2024-12-13 | $328.49 | $415.00 | $4,277,038 | $13,810,122 | $9,533,085 | 222.89% |
| Skip top 20% ROI trades | 2022-07-12 | 2022-08-12 | $233.07 | $291.67 | $454,950 | $1,409,221 | $954,271 | 209.75% |
| Skip top 20% ROI trades | 2024-10-08 | 2024-11-08 | $244.50 | $310.00 | $1,273,049 | $3,829,386 | $2,556,337 | 200.80% |
| Skip top 20% ROI trades | 2020-07-23 | 2020-08-21 | $100.87 | $126.67 | $209,575 | $490,934 | $281,359 | 134.25% |
| Skip top 20% ROI trades | 2020-03-26 | 2020-04-24 | $35.21 | $44.33 | $79,752 | $180,851 | $101,099 | 126.77% |
| Skip top 20% ROI trades | 2023-06-02 | 2023-07-07 | $213.97 | $270.00 | $747,846 | $1,673,208 | $925,362 | 123.74% |
| Skip top 20% ROI trades | 2024-11-26 | 2024-12-27 | $338.23 | $425.00 | $3,945,445 | $7,902,760 | $3,957,315 | 100.30% |
| Skip top 20% ROI trades | 2022-06-28 | 2022-07-29 | $232.66 | $291.67 | $481,388 | $662,386 | $180,998 | 37.60% |
| Skip top 20% ROI trades | 2019-04-17 | 2019-05-17 | $18.08 | $22.67 | $1,727 | $0 | -$1,727 | -100.00% |
| Skip top 20% ROI trades | 2024-02-16 | 2024-03-15 | $199.95 | $250.00 | $1,174,600 | $0 | -$1,174,600 | -100.00% |
| Skip top 20% ROI trades | 2024-02-23 | 2024-03-22 | $191.97 | $240.00 | $1,072,860 | $0 | -$1,072,860 | -100.00% |
| Skip top 20% ROI trades | 2024-03-01 | 2024-03-28 | $202.64 | $255.00 | $1,053,729 | $0 | -$1,053,729 | -100.00% |
| Skip top 20% ROI trades | 2024-03-08 | 2024-04-05 | $175.34 | $220.00 | $1,010,650 | $0 | -$1,010,650 | -100.00% |
| Skip top 20% ROI trades | 2019-05-01 | 2019-05-31 | $15.60 | $19.67 | $1,609 | $0 | -$1,609 | -100.00% |
| Skip top 20% ROI trades | 2024-03-22 | 2024-04-19 | $170.83 | $215.00 | $968,670 | $0 | -$968,670 | -100.00% |
| Skip top 20% ROI trades | 2024-04-01 | 2024-05-03 | $175.22 | $220.00 | $967,512 | $0 | -$967,512 | -100.00% |
| Skip top 20% ROI trades | 2024-04-08 | 2024-05-10 | $172.98 | $220.00 | $915,813 | $0 | -$915,813 | -100.00% |
| Skip top 20% ROI trades | 2024-04-15 | 2024-05-17 | $161.48 | $205.00 | $895,040 | $0 | -$895,040 | -100.00% |
Oracle Skip Output Data
The outlier stress CSV outputs are written beside this report as options_only_staggered_weekly_call_oracle_skip_summary.csv, options_only_staggered_weekly_call_oracle_skip_cycles.csv, and options_only_staggered_weekly_call_oracle_skip_equity.csv.
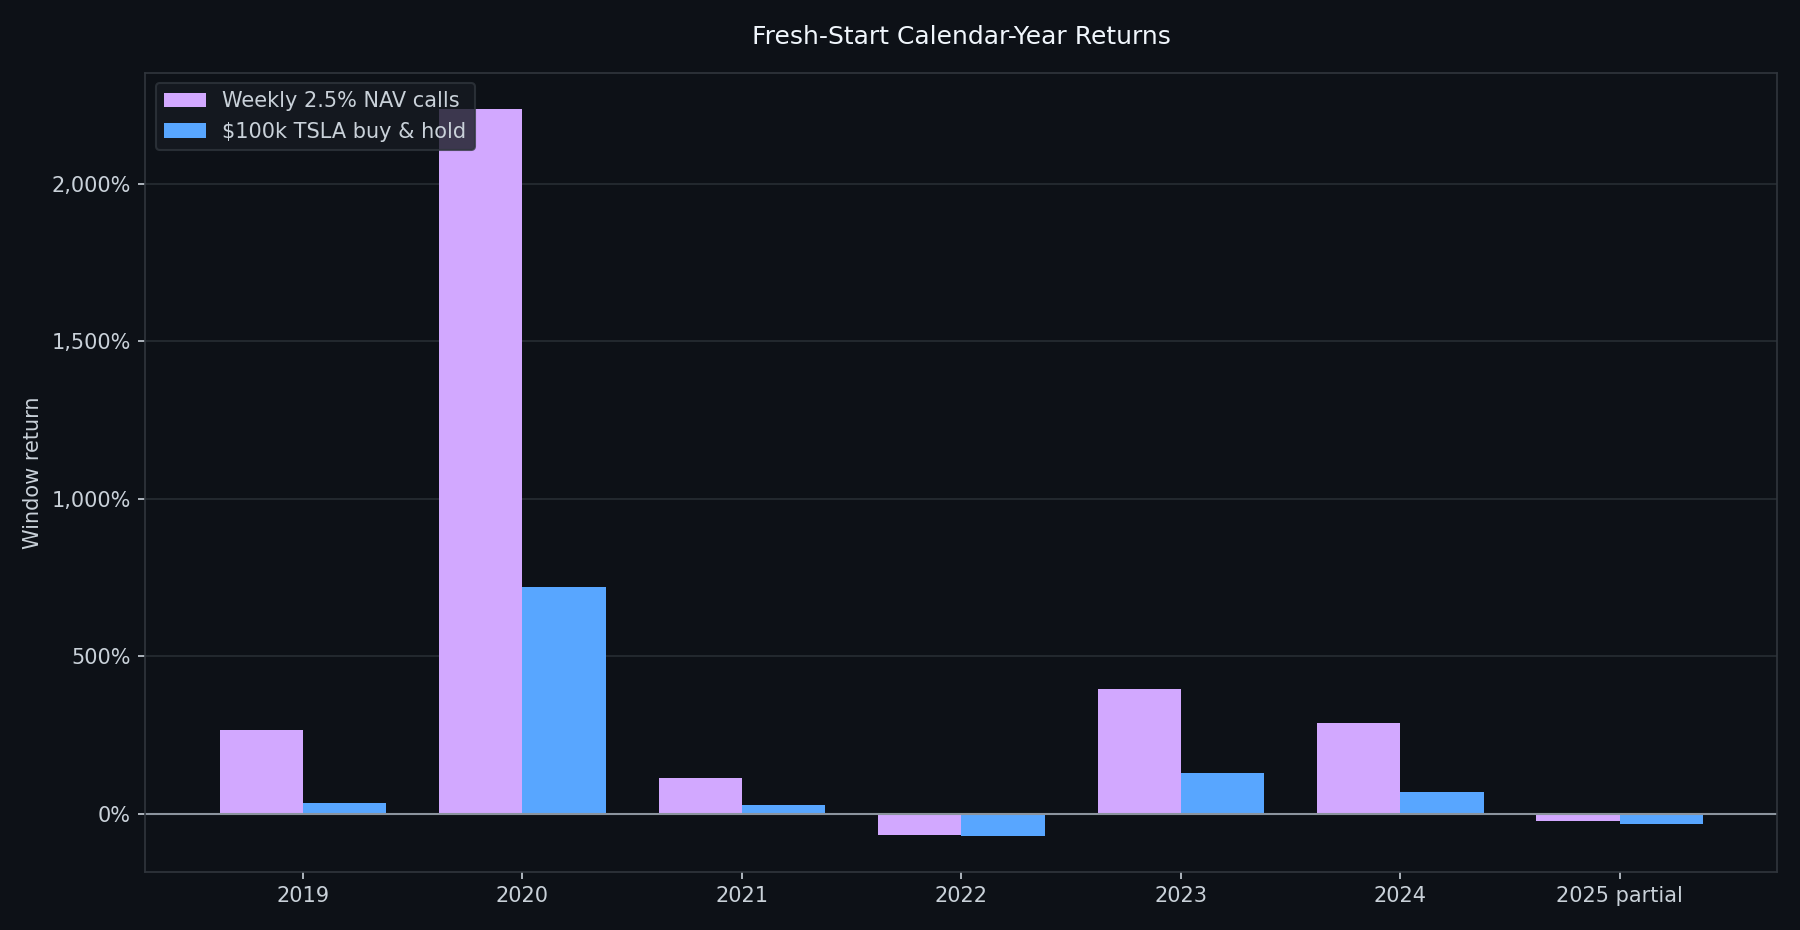
Fresh-Start Windows: Calendar Years and Historical Regimes
Question: Does the weekly call strategy work across many different start dates, or mostly because the full-window test includes a few great bursts?
This section restarts both strategies at $100,000 inside each window. The call strategy uses the same staggered weekly 2.5% NAV / roughly 30D / 25% OTM rule, and the comparison line buys and holds TSLA from the same first valid date. Calendar years answer the lived question of how often the strategy had a good year; curated periods answer which market regimes it likes or hates.
Fresh-Start Scorecard
Calendar-Year Fresh Starts
| Window | Start | End | Call final NAV | Call return | Call max DD | TSLA final NAV | TSLA return | TSLA max DD | Call win rate | Trades | Beat TSLA | Profitable |
|---|---|---|---|---|---|---|---|---|---|---|---|---|
| 2019 | 2019-01-02 | 2019-12-31 | $365,669 | 265.67% | -64.20% | $134,887 | 34.89% | -48.46% | 12.77% | 47 | yes | yes |
| 2020 | 2020-01-02 | 2020-12-31 | $2,337,381 | 2,237.38% | -50.04% | $819,996 | 720.00% | -60.62% | 36.36% | 44 | yes | yes |
| 2021 | 2021-01-07 | 2021-12-31 | $214,616 | 114.62% | -62.42% | $129,451 | 29.45% | -36.19% | 8.33% | 48 | yes | yes |
| 2022 | 2022-01-03 | 2022-12-30 | $32,683 | -67.32% | -79.04% | $30,813 | -69.19% | -72.71% | 4.17% | 48 | yes | no |
| 2023 | 2023-01-03 | 2023-12-29 | $494,738 | 394.74% | -49.04% | $229,851 | 129.85% | -32.72% | 18.75% | 48 | yes | yes |
| 2024 | 2024-01-02 | 2024-12-30 | $386,820 | 286.82% | -59.70% | $167,934 | 67.93% | -42.76% | 20.83% | 48 | yes | yes |
| 2025 partial | 2025-01-02 | 2025-04-11 | $77,072 | -22.93% | -25.23% | $66,607 | -33.39% | -48.08% | 0.00% | 11 | yes | no |
Curated Historical Period Fresh Starts
These are the same period windows from config/periods.yaml, limited to windows fully covered by the real historical option chain.
| Window | Tag | Start | End | Call final NAV | Call return | Call max DD | TSLA final NAV | TSLA return | TSLA max DD | Call win rate | Trades | Beat TSLA | Profitable |
|---|---|---|---|---|---|---|---|---|---|---|---|---|---|
| bad_x3_2019_01_to_2019_12 | bad_x3 | 2019-01-02 | 2019-12-31 | $365,669 | 265.67% | -64.20% | $134,887 | 34.89% | -48.46% | 12.77% | 47 | yes | yes |
| ends_higher_2019_01_to_2020_01 | ends_higher | 2019-01-02 | 2020-01-02 | $365,669 | 265.67% | -64.20% | $138,733 | 38.73% | -48.46% | 12.77% | 47 | yes | yes |
| full_real_options_2019_01_to_2025_04 | full | 2019-01-02 | 2025-04-11 | $133,913,421 | 133,813.42% | -90.18% | $1,220,188 | 1,120.19% | -73.63% | 16.83% | 315 | yes | yes |
| up_strong_2019_06_to_2022_06 | up_strong | 2019-06-03 | 2022-06-03 | $24,952,152 | 24,852.15% | -78.28% | $1,965,488 | 1,865.49% | -60.63% | 22.60% | 146 | yes | yes |
| smooth_2019_08_to_2020_01 | low_dd | 2019-08-02 | 2020-01-31 | $3,781,467 | 3,681.47% | -42.04% | $277,591 | 177.59% | -11.29% | 40.91% | 22 | yes | yes |
| smooth_2021_05_to_2021_10 | low_dd | 2021-05-04 | 2021-10-29 | $155,197 | 55.20% | -42.62% | $165,326 | 65.33% | -16.34% | 4.55% | 22 | no | yes |
| flat_2021_06_to_2023_06 | flat | 2021-06-01 | 2023-06-01 | $145,793 | 45.79% | -89.44% | $99,786 | -0.21% | -73.57% | 11.00% | 100 | yes | yes |
| round_trip_up_2021_07_to_2022_07 | round_trip_up | 2021-07-01 | 2022-07-01 | $198,830 | 98.83% | -79.98% | $100,570 | 0.57% | -48.89% | 8.33% | 48 | yes | yes |
| ends_higher_2021_08_to_2022_08 | ends_higher | 2021-08-02 | 2022-08-02 | $175,043 | 75.04% | -81.53% | $127,021 | 27.02% | -48.88% | 10.42% | 48 | yes | yes |
| bad_x3_2021_11_to_2023_06 | bad_x3 | 2021-11-04 | 2023-06-30 | $199,343 | 99.34% | -80.32% | $63,987 | -36.01% | -73.35% | 12.35% | 81 | yes | yes |
| ends_lower_2021_12_to_2023_12 | ends_lower | 2021-12-01 | 2023-12-01 | $185,143 | 85.14% | -80.53% | $65,556 | -34.44% | -72.73% | 12.87% | 101 | yes | yes |
| down_strong_2022_01_to_2023_01 | down_strong | 2022-01-03 | 2023-01-03 | $32,683 | -67.32% | -79.04% | $27,043 | -72.96% | -72.96% | 4.17% | 48 | yes | no |
| down_strong_2022_08_to_2024_02 | down_strong | 2022-08-01 | 2024-02-01 | $270,926 | 170.93% | -53.98% | $63,572 | -36.43% | -64.98% | 13.51% | 74 | yes | yes |
| round_trip_down_2022_10_to_2023_10 | round_trip_down | 2022-10-03 | 2023-10-03 | $541,198 | 441.20% | -40.39% | $101,702 | 1.70% | -56.59% | 20.83% | 48 | yes | yes |
| ends_higher_2022_12_to_2023_12 | ends_higher | 2022-12-01 | 2023-12-01 | $546,741 | 446.74% | -43.23% | $122,639 | 22.64% | -44.47% | 18.37% | 49 | yes | yes |
| round_trip_up_2023_02_to_2024_02 | round_trip_up | 2023-02-01 | 2024-02-01 | $176,636 | 76.64% | -53.85% | $104,105 | 4.10% | -37.73% | 10.42% | 48 | yes | yes |
| bad_x3_2023_07_to_2024_09 | bad_x3 | 2023-07-03 | 2024-09-30 | $56,108 | -43.89% | -72.49% | $93,506 | -6.49% | -51.52% | 4.92% | 61 | no | no |
| ends_higher_2023_08_to_2025_01 | ends_higher | 2023-08-01 | 2025-01-31 | $190,142 | 90.14% | -69.23% | $154,972 | 54.97% | -48.54% | 13.33% | 75 | yes | yes |
| ends_lower_2023_08_to_2024_08 | ends_lower | 2023-08-01 | 2024-08-01 | $79,829 | -20.17% | -69.23% | $83,068 | -16.93% | -48.54% | 6.25% | 48 | no | no |
| round_trip_down_2023_10_to_2024_10 | round_trip_down | 2023-10-02 | 2024-10-02 | $76,639 | -23.36% | -63.24% | $98,976 | -1.02% | -46.07% | 6.25% | 48 | no | no |
Fresh-Start Window Output Data
The full window summary is written beside this report as options_only_staggered_weekly_call_period_window_summary.csv.
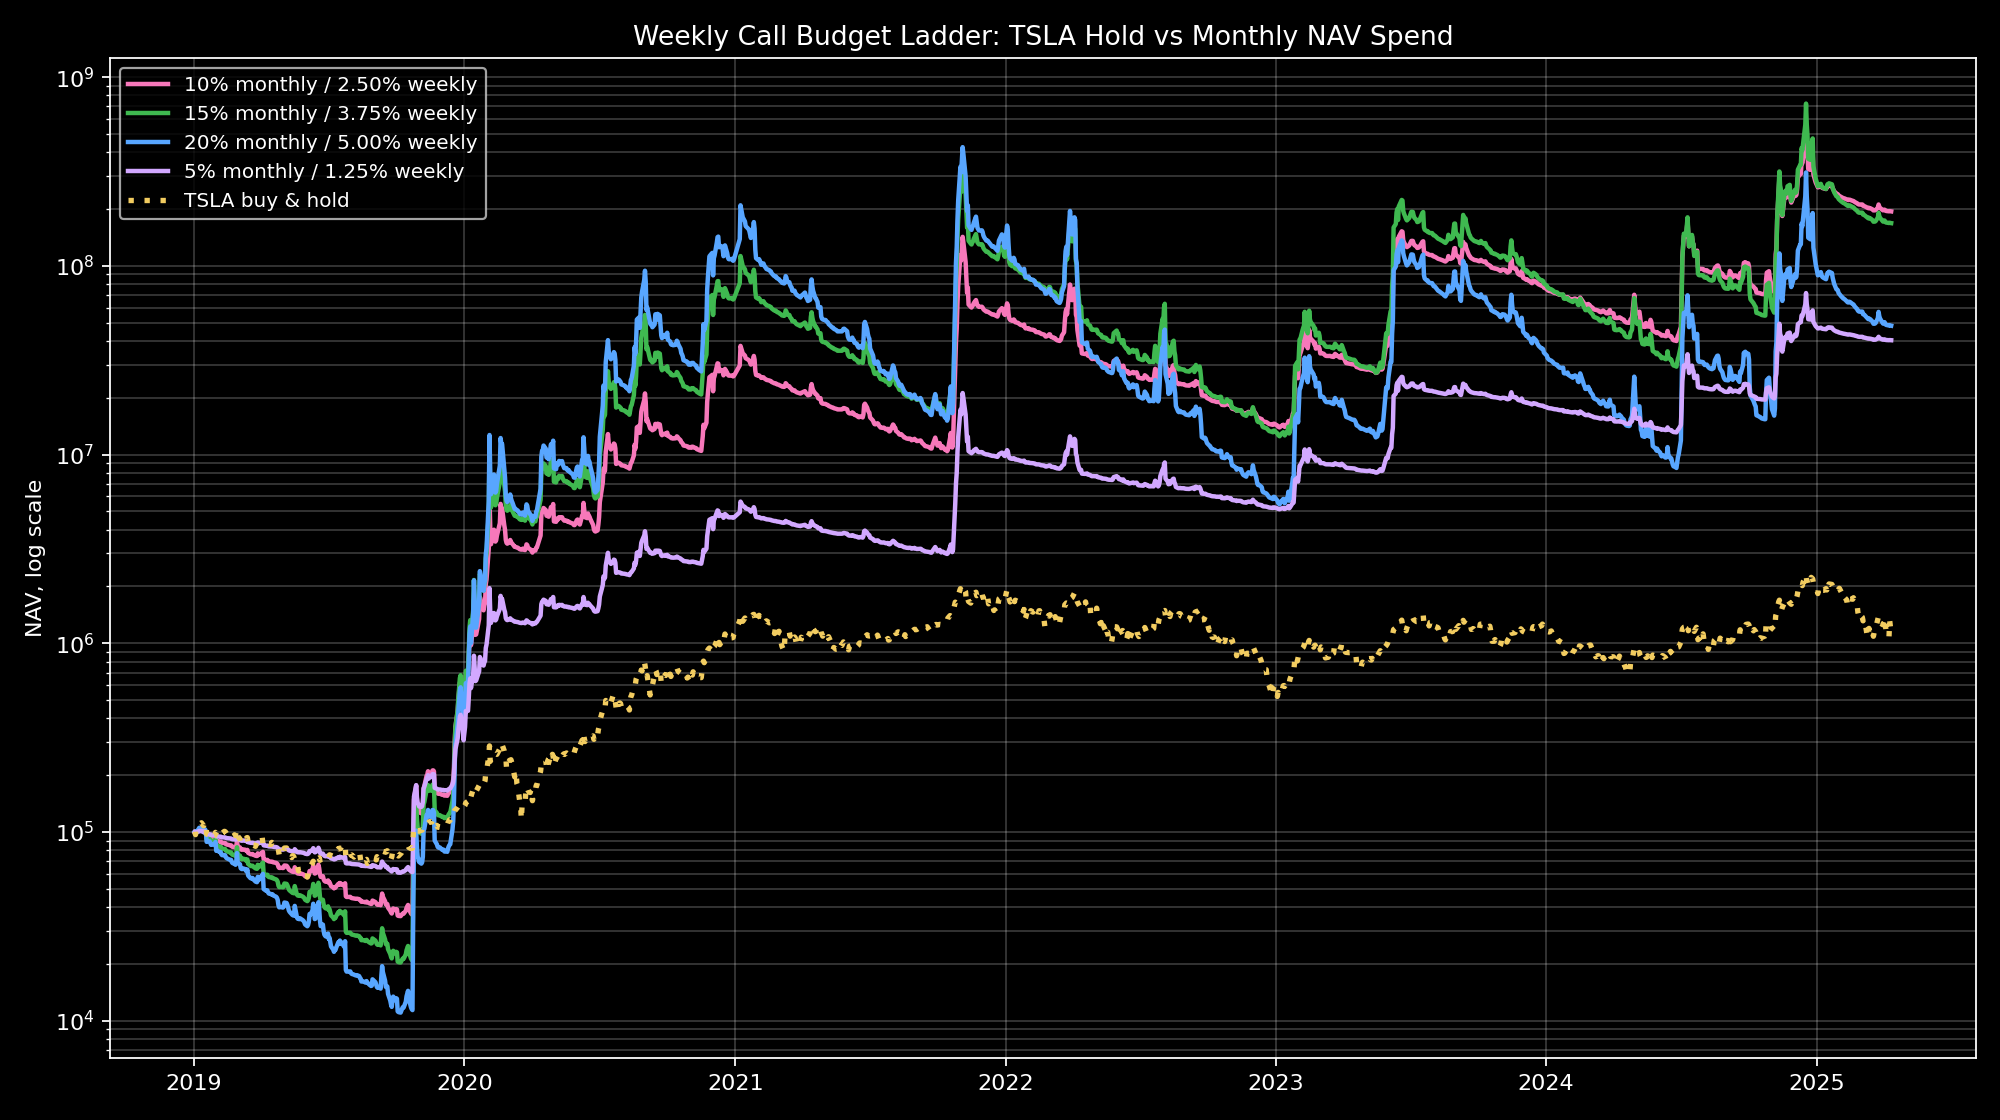
Weekly Budget Ladder
Question: How does the staggered weekly call strategy change when the monthly spend target is 20%, 15%, 10%, or 5% of NAV?
Each line starts at $100,000 on 2019-01-02. The monthly budget is split across four weekly entries, so the weekly spend targets are 5.00%, 3.75%, 2.50%, and 1.25% of current marked NAV. The 10% monthly row is the same 2.50% weekly rule used in the existing staggered weekly section.
Budget Ladder NAV
Budget Ladder Summary
| Strategy | Initial NAV | Final NAV | Total return | CAGR | Max drawdown | DD peak | DD trough | Cycles | Win rate | Premium paid | Expiry payoff | Payoff - premium | Skipped |
|---|---|---|---|---|---|---|---|---|---|---|---|---|---|
| TSLA buy & hold | $100,000 | $1,220,188 | 1,120.19% | 49.01% | -73.63% | 2021-11-04 | 2023-01-03 | 0 | 0.00% | $0 | $0 | $0 | 0 |
| 20% monthly / 5.00% weekly | $100,000 | $48,188,628 | 48,088.63% | 167.75% | -98.72% | 2021-11-04 | 2023-01-06 | 321 | 17.76% | $652,694,106 | $700,782,734 | $48,088,628 | 4 |
| 15% monthly / 3.75% weekly | $100,000 | $168,430,237 | 168,330.24% | 226.88% | -96.25% | 2021-11-04 | 2023-01-06 | 321 | 17.76% | $722,718,894 | $891,049,131 | $168,330,237 | 4 |
| 10% monthly / 2.50% weekly | $100,000 | $194,399,516 | 194,299.52% | 234.43% | -90.23% | 2021-11-04 | 2023-01-06 | 321 | 17.76% | $382,665,227 | $576,964,742 | $194,299,516 | 4 |
| 5% monthly / 1.25% weekly | $100,000 | $40,361,207 | 40,261.21% | 160.29% | -75.78% | 2021-11-04 | 2023-01-06 | 321 | 17.76% | $40,343,926 | $80,605,132 | $40,261,207 | 4 |
Budget Ladder Output Data
The budget ladder CSV outputs are written beside this report as options_only_staggered_weekly_call_budget_ladder_equity.csv, options_only_staggered_weekly_call_budget_ladder_summary.csv, and options_only_staggered_weekly_call_budget_ladder_cycles.csv.
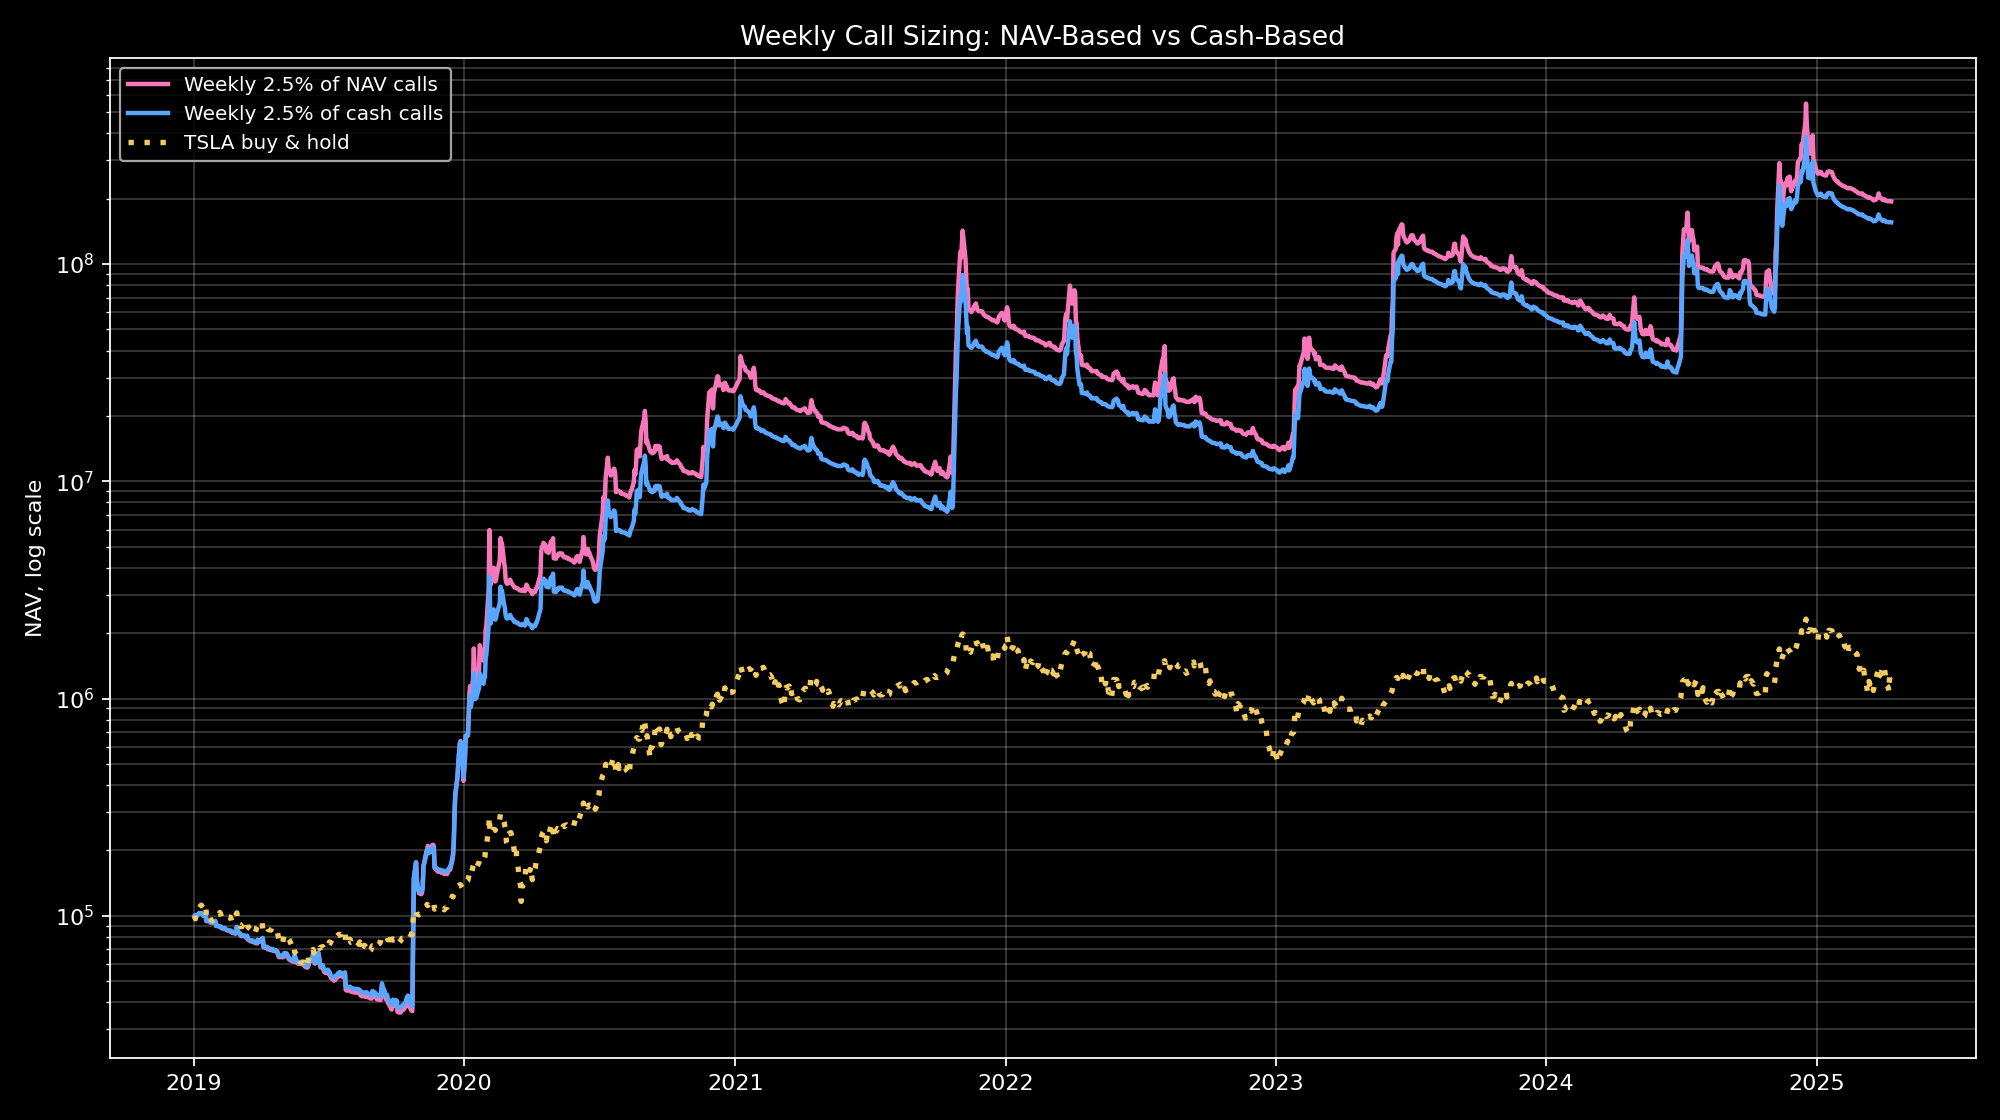
Weekly 10% Monthly Budget: NAV-Based vs Cash-Based Sizing
Question: Should the weekly 2.5% call buy be sized from total marked NAV, or only from cash?
Why this test matters: NAV-based sizing can pyramid unrealized option gains during sharp TSLA rallies, causing larger buys near temporarily inflated NAV. If TSLA then reverses, both the appreciated existing options and the larger new buys can disappear. Cash-based sizing tests whether limiting buys to realized cash produces a better risk/return tradeoff.
Each option line starts at $100,000 on 2019-01-02 and buys weekly calls using the same real historical option mids, roughly 30D expiries, and the listed call strike nearest 125% of TSLA close. The cash-based line sizes after same-day expiries/payoffs settle, so realized option payoffs can fund the next buy but open option marks cannot.
NAV vs Cash Sizing NAV
NAV vs Cash Sizing Summary
| Strategy | Initial NAV | Final NAV | Total return | CAGR | Max drawdown | DD peak | DD trough | Cycles | Win rate | Premium paid | Expiry payoff | Payoff - premium | Avg premium/buy | Skipped |
|---|---|---|---|---|---|---|---|---|---|---|---|---|---|---|
| TSLA buy & hold | $100,000 | $1,220,188 | 1,120.19% | 49.01% | -73.63% | 2021-11-04 | 2023-01-03 | 0 | 0.00% | $0 | $0 | $0 | $0 | 0 |
| Weekly 2.5% of NAV calls | $100,000 | $194,399,516 | 194,299.52% | 234.43% | -90.23% | 2021-11-04 | 2023-01-06 | 321 | 17.76% | $382,665,227 | $576,964,742 | $194,299,516 | $1,192,104 | 4 |
| Weekly 2.5% of cash calls | $100,000 | $155,701,941 | 155,601.94% | 222.81% | -87.67% | 2021-11-04 | 2023-01-06 | 321 | 17.76% | $255,070,195 | $410,672,137 | $155,601,941 | $794,611 | 4 |
NAV vs Cash Sizing Output Data
The sizing comparison CSV outputs are written beside this report as options_only_weekly_nav_vs_cash_sizing_equity.csv, options_only_weekly_nav_vs_cash_sizing_summary.csv, and options_only_weekly_nav_vs_cash_sizing_cycles.csv.