Real-options-only put-selling tests. Period: 2019-01-02 to 2025-04-04.
Account Strategy
Account strategy - 2026-05-22: Use a dedicated put-selling account, starting conservatively with enough capital for one put rather than forcing capital out of the TSLA X2/NX2 strategy while it is already pushed down.
- Current IBKR margin check: about 147,000 SEK margin is required to sell one TSLA put today; about 235,000 SEK is required to sell two puts today.
- Initial action: fund the put account with 150,000 SEK and buy TSLA shares in that account now. Treat this as the first put-selling account base.
- Cash reserve: keep the current 482,000 SEK cash balance intact rather than investing all available cash.
- Scale-up trigger: after TSLA has recovered, sell/transfer roughly another 150,000 SEK, or whatever margin is required at that time, from the X2/NX2 strategy account to fund a second put-selling sleeve.
- Operating rule: start with one short put; only move to two short puts once the second sleeve is separately funded and the margin requirement is confirmed again in IBKR.
One-Contract Monthly Put Test
Question: Was selling one 25% OTM TSLA put each month profitable by itself?
Each cycle sells exactly one listed put from the real historical chain, choosing the strike nearest 75% of TSLA close, holds it to expiry, and records premium minus terminal intrinsic value.
Rule
- Sell 1 TSLA put contract per monthly cycle.
- Use the first listed put expiry in the next calendar month.
- Pick the listed put strike nearest 75% of TSLA close on the sale date.
- Use real option mid only:
(open + close) / 2fromdata/real_options.parquet. - No synthetic option prices, no Black-Scholes fallback, no buyback.
Full-Window Summary
Cumulative P&L vs TSLA
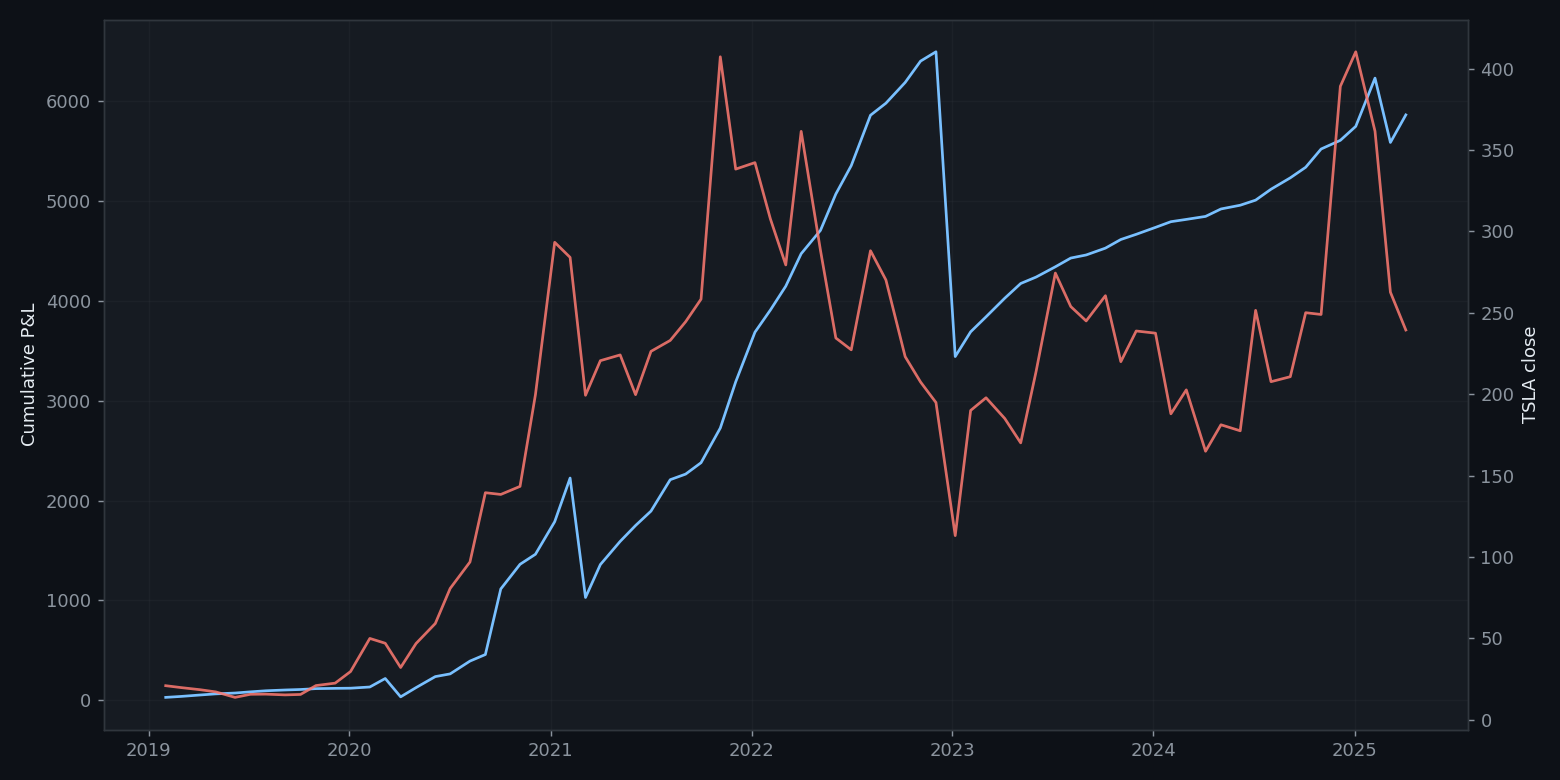
Full Trade Ledger (75 Trades)
Every executed monthly put cycle is shown here; the table scrolls both vertically and horizontally.
| # | Sale date | TSLA close | 75% target | Put strike | Actual OTM | Expiry | DTE | Premium/share | Premium/contract | Expiry TSLA close | Intrinsic/share | Terminal loss | ITM/assigned | Cycle P&L | Cumulative P&L |
|---|---|---|---|---|---|---|---|---|---|---|---|---|---|---|---|
| 1 | 2019-01-02 | $21 | $16 | $16 | 24.22% | 2019-02-01 | 30 | $0 | $27 | $21 | 0.00 | $0 | no | $27 | $27 |
| 2 | 2019-02-01 | $21 | $16 | $16 | 24.73% | 2019-03-01 | 28 | $0 | $10 | $20 | 0.00 | $0 | no | $10 | $36 |
| 3 | 2019-03-01 | $20 | $15 | $15 | 25.37% | 2019-04-05 | 35 | $0 | $15 | $18 | 0.00 | $0 | no | $15 | $51 |
| 4 | 2019-04-05 | $18 | $14 | $14 | 25.44% | 2019-05-03 | 28 | $0 | $11 | $17 | 0.00 | $0 | no | $11 | $62 |
| 5 | 2019-05-03 | $17 | $13 | $13 | 25.50% | 2019-06-07 | 35 | $0 | $8 | $14 | 0.00 | $0 | no | $8 | $71 |
| 6 | 2019-06-07 | $14 | $10 | $10 | 24.21% | 2019-07-05 | 28 | $0 | $12 | $16 | 0.00 | $0 | no | $12 | $82 |
| 7 | 2019-07-05 | $16 | $12 | $12 | 24.92% | 2019-08-02 | 28 | $0 | $11 | $16 | 0.00 | $0 | no | $11 | $93 |
| 8 | 2019-08-02 | $16 | $12 | $12 | 23.19% | 2019-09-06 | 35 | $0 | $8 | $15 | 0.00 | $0 | no | $8 | $101 |
| 9 | 2019-09-06 | $15 | $11 | $11 | 25.26% | 2019-10-04 | 28 | $0 | $5 | $15 | 0.00 | $0 | no | $5 | $106 |
| 10 | 2019-10-04 | $15 | $12 | $12 | 24.38% | 2019-11-01 | 28 | $0 | $9 | $21 | 0.00 | $0 | no | $9 | $115 |
| 11 | 2019-11-01 | $21 | $16 | $15 | 28.19% | 2019-12-06 | 35 | $0 | $3 | $22 | 0.00 | $0 | no | $3 | $117 |
| 12 | 2019-12-06 | $22 | $17 | $17 | 25.57% | 2020-01-03 | 28 | $0 | $2 | $30 | 0.00 | $0 | no | $2 | $119 |
| 13 | 2020-01-03 | $30 | $22 | $22 | 25.51% | 2020-02-07 | 35 | $0 | $12 | $50 | 0.00 | $0 | no | $12 | $131 |
| 14 | 2020-02-07 | $50 | $37 | $37 | 25.14% | 2020-03-06 | 28 | $1 | $85 | $47 | 0.00 | $0 | no | $85 | $216 |
| 15 | 2020-03-06 | $47 | $35 | $35 | 24.66% | 2020-04-03 | 28 | $1 | $149 | $32 | 3.33 | $333 | yes | $-184 | $32 |
| 16 | 2020-04-03 | $32 | $24 | $24 | 25.00% | 2020-05-01 | 28 | $1 | $93 | $47 | 0.00 | $0 | no | $93 | $125 |
| 17 | 2020-05-01 | $47 | $35 | $35 | 24.43% | 2020-06-05 | 35 | $1 | $110 | $59 | 0.00 | $0 | no | $110 | $235 |
| 18 | 2020-06-05 | $59 | $44 | $44 | 25.48% | 2020-07-02 | 27 | $0 | $27 | $81 | 0.00 | $0 | no | $27 | $262 |
| 19 | 2020-07-02 | $81 | $60 | $60 | 25.12% | 2020-08-07 | 36 | $1 | $128 | $97 | 0.00 | $0 | no | $128 | $391 |
| 20 | 2020-08-07 | $97 | $73 | $73 | 24.28% | 2020-09-04 | 28 | $1 | $66 | $139 | 0.00 | $0 | no | $66 | $456 |
| 21 | 2020-09-04 | $139 | $105 | $105 | 24.94% | 2020-10-02 | 28 | $7 | $657 | $138 | 0.00 | $0 | no | $657 | $1,114 |
| 22 | 2020-10-02 | $138 | $104 | $103 | 25.32% | 2020-11-06 | 35 | $2 | $247 | $143 | 0.00 | $0 | no | $247 | $1,361 |
| 23 | 2020-11-06 | $143 | $107 | $107 | 25.57% | 2020-12-04 | 28 | $1 | $101 | $200 | 0.00 | $0 | no | $101 | $1,461 |
| 24 | 2020-12-04 | $200 | $150 | $150 | 24.88% | 2021-01-08 | 35 | $3 | $326 | $293 | 0.00 | $0 | no | $326 | $1,788 |
| 25 | 2021-01-08 | $293 | $220 | $220 | 25.00% | 2021-02-05 | 28 | $4 | $438 | $284 | 0.00 | $0 | no | $438 | $2,225 |
| 26 | 2021-02-05 | $284 | $213 | $213 | 24.90% | 2021-03-05 | 28 | $2 | $204 | $199 | 14.02 | $1,402 | yes | $-1,197 | $1,028 |
| 27 | 2021-03-05 | $199 | $149 | $150 | 24.74% | 2021-04-01 | 27 | $3 | $330 | $221 | 0.00 | $0 | no | $330 | $1,358 |
| 28 | 2021-04-01 | $221 | $165 | $167 | 24.44% | 2021-05-07 | 36 | $2 | $232 | $224 | 0.00 | $0 | no | $232 | $1,590 |
| 29 | 2021-05-07 | $224 | $168 | $167 | 25.64% | 2021-06-04 | 28 | $2 | $159 | $200 | 0.00 | $0 | no | $159 | $1,750 |
| 30 | 2021-06-04 | $200 | $150 | $150 | 24.88% | 2021-07-02 | 28 | $1 | $144 | $226 | 0.00 | $0 | no | $144 | $1,894 |
| 31 | 2021-07-02 | $226 | $170 | $170 | 24.88% | 2021-08-06 | 35 | $3 | $315 | $233 | 0.00 | $0 | no | $315 | $2,209 |
| 32 | 2021-08-06 | $233 | $175 | $173 | 25.62% | 2021-09-03 | 28 | $1 | $56 | $245 | 0.00 | $0 | no | $56 | $2,265 |
| 33 | 2021-09-03 | $245 | $183 | $183 | 25.02% | 2021-10-01 | 28 | $1 | $114 | $258 | 0.00 | $0 | no | $114 | $2,379 |
| 34 | 2021-10-01 | $258 | $194 | $193 | 25.18% | 2021-11-05 | 35 | $3 | $348 | $407 | 0.00 | $0 | no | $348 | $2,726 |
| 35 | 2021-11-05 | $407 | $306 | $307 | 24.72% | 2021-12-03 | 28 | $5 | $463 | $338 | 0.00 | $0 | no | $463 | $3,189 |
| 36 | 2021-12-03 | $338 | $254 | $250 | 26.11% | 2022-01-07 | 35 | $5 | $498 | $342 | 0.00 | $0 | no | $498 | $3,687 |
| 37 | 2022-01-07 | $342 | $257 | $257 | 25.02% | 2022-02-04 | 28 | $2 | $222 | $308 | 0.00 | $0 | no | $222 | $3,909 |
| 38 | 2022-02-04 | $308 | $231 | $233 | 24.19% | 2022-03-04 | 28 | $2 | $240 | $279 | 0.00 | $0 | no | $240 | $4,148 |
| 39 | 2022-03-04 | $279 | $210 | $217 | 22.46% | 2022-04-01 | 28 | $3 | $325 | $362 | 0.00 | $0 | no | $325 | $4,474 |
| 40 | 2022-04-01 | $362 | $271 | $268 | 25.78% | 2022-05-06 | 35 | $2 | $233 | $289 | 0.00 | $0 | no | $233 | $4,707 |
| 41 | 2022-05-06 | $289 | $216 | $217 | 24.91% | 2022-06-03 | 28 | $4 | $365 | $235 | 0.00 | $0 | no | $365 | $5,072 |
| 42 | 2022-06-03 | $235 | $176 | $177 | 24.67% | 2022-07-01 | 28 | $3 | $284 | $227 | 0.00 | $0 | no | $284 | $5,357 |
| 43 | 2022-07-01 | $227 | $170 | $170 | 25.20% | 2022-08-05 | 35 | $5 | $505 | $288 | 0.00 | $0 | no | $505 | $5,862 |
| 44 | 2022-08-05 | $288 | $216 | $217 | 24.81% | 2022-09-02 | 28 | $1 | $120 | $270 | 0.00 | $0 | no | $120 | $5,982 |
| 45 | 2022-09-02 | $270 | $203 | $205 | 24.13% | 2022-10-07 | 35 | $2 | $208 | $223 | 0.00 | $0 | no | $208 | $6,190 |
| 46 | 2022-10-07 | $223 | $167 | $165 | 26.03% | 2022-11-04 | 28 | $2 | $214 | $207 | 0.00 | $0 | no | $214 | $6,404 |
| 47 | 2022-11-04 | $207 | $156 | $155 | 25.29% | 2022-12-02 | 28 | $1 | $94 | $195 | 0.00 | $0 | no | $94 | $6,498 |
| 48 | 2022-12-02 | $195 | $146 | $145 | 25.59% | 2023-01-06 | 35 | $1 | $140 | $113 | 31.94 | $3,194 | yes | $-3,055 | $3,443 |
| 49 | 2023-01-06 | $113 | $85 | $85 | 24.82% | 2023-02-03 | 28 | $2 | $248 | $190 | 0.00 | $0 | no | $248 | $3,691 |
| 50 | 2023-02-03 | $190 | $142 | $142 | 25.26% | 2023-03-03 | 28 | $2 | $150 | $198 | 0.00 | $0 | no | $150 | $3,841 |
| 51 | 2023-03-03 | $198 | $148 | $150 | 24.16% | 2023-04-06 | 34 | $2 | $186 | $185 | 0.00 | $0 | no | $186 | $4,028 |
| 52 | 2023-04-06 | $185 | $139 | $140 | 24.35% | 2023-05-05 | 29 | $1 | $148 | $170 | 0.00 | $0 | no | $148 | $4,175 |
| 53 | 2023-05-05 | $170 | $128 | $130 | 23.56% | 2023-06-02 | 28 | $1 | $64 | $214 | 0.00 | $0 | no | $64 | $4,240 |
| 54 | 2023-06-02 | $214 | $160 | $160 | 25.22% | 2023-07-07 | 35 | $1 | $103 | $274 | 0.00 | $0 | no | $103 | $4,343 |
| 55 | 2023-07-07 | $274 | $206 | $205 | 25.30% | 2023-08-04 | 28 | $1 | $88 | $254 | 0.00 | $0 | no | $88 | $4,430 |
| 56 | 2023-08-04 | $254 | $190 | $190 | 25.16% | 2023-09-01 | 28 | $0 | $31 | $245 | 0.00 | $0 | no | $31 | $4,461 |
| 57 | 2023-09-01 | $245 | $184 | $185 | 24.49% | 2023-10-06 | 35 | $1 | $68 | $261 | 0.00 | $0 | no | $68 | $4,530 |
| 58 | 2023-10-06 | $261 | $195 | $195 | 25.15% | 2023-11-03 | 28 | $1 | $86 | $220 | 0.00 | $0 | no | $86 | $4,616 |
| 59 | 2023-11-03 | $220 | $165 | $165 | 24.99% | 2023-12-01 | 28 | $1 | $52 | $239 | 0.00 | $0 | no | $52 | $4,668 |
| 60 | 2023-12-01 | $239 | $179 | $180 | 24.63% | 2024-01-05 | 35 | $1 | $70 | $237 | 0.00 | $0 | no | $70 | $4,738 |
| 61 | 2024-01-05 | $237 | $178 | $180 | 24.21% | 2024-02-02 | 28 | $1 | $57 | $188 | 0.00 | $0 | no | $57 | $4,795 |
| 62 | 2024-02-02 | $188 | $141 | $140 | 25.50% | 2024-03-01 | 28 | $0 | $23 | $203 | 0.00 | $0 | no | $23 | $4,818 |
| 63 | 2024-03-01 | $203 | $152 | $150 | 25.98% | 2024-04-05 | 35 | $0 | $30 | $165 | 0.00 | $0 | no | $30 | $4,848 |
| 64 | 2024-04-05 | $165 | $124 | $125 | 24.20% | 2024-05-03 | 28 | $1 | $74 | $181 | 0.00 | $0 | no | $74 | $4,922 |
| 65 | 2024-05-03 | $181 | $136 | $135 | 25.49% | 2024-06-07 | 35 | $0 | $38 | $177 | 0.00 | $0 | no | $38 | $4,960 |
| 66 | 2024-06-07 | $177 | $133 | $135 | 23.94% | 2024-07-05 | 28 | $1 | $51 | $252 | 0.00 | $0 | no | $51 | $5,011 |
| 67 | 2024-07-05 | $252 | $189 | $190 | 24.46% | 2024-08-02 | 28 | $1 | $110 | $208 | 0.00 | $0 | no | $110 | $5,120 |
| 68 | 2024-08-02 | $208 | $156 | $155 | 25.36% | 2024-09-06 | 35 | $1 | $114 | $211 | 0.00 | $0 | no | $114 | $5,234 |
| 69 | 2024-09-06 | $211 | $158 | $160 | 24.07% | 2024-10-04 | 28 | $1 | $106 | $250 | 0.00 | $0 | no | $106 | $5,340 |
| 70 | 2024-10-04 | $250 | $188 | $190 | 24.02% | 2024-11-01 | 28 | $2 | $183 | $249 | 0.00 | $0 | no | $183 | $5,523 |
| 71 | 2024-11-01 | $249 | $187 | $185 | 25.70% | 2024-12-06 | 35 | $1 | $87 | $389 | 0.00 | $0 | no | $87 | $5,610 |
| 72 | 2024-12-06 | $389 | $292 | $290 | 25.49% | 2025-01-03 | 28 | $1 | $140 | $410 | 0.00 | $0 | no | $140 | $5,750 |
| 73 | 2025-01-03 | $410 | $308 | $310 | 24.47% | 2025-02-07 | 35 | $5 | $484 | $362 | 0.00 | $0 | no | $484 | $6,234 |
| 74 | 2025-02-07 | $362 | $271 | $270 | 25.34% | 2025-03-07 | 28 | $1 | $88 | $263 | 7.33 | $733 | yes | $-645 | $5,589 |
| 75 | 2025-03-07 | $263 | $197 | $195 | 25.76% | 2025-04-04 | 28 | $3 | $276 | $239 | 0.00 | $0 | no | $276 | $5,865 |
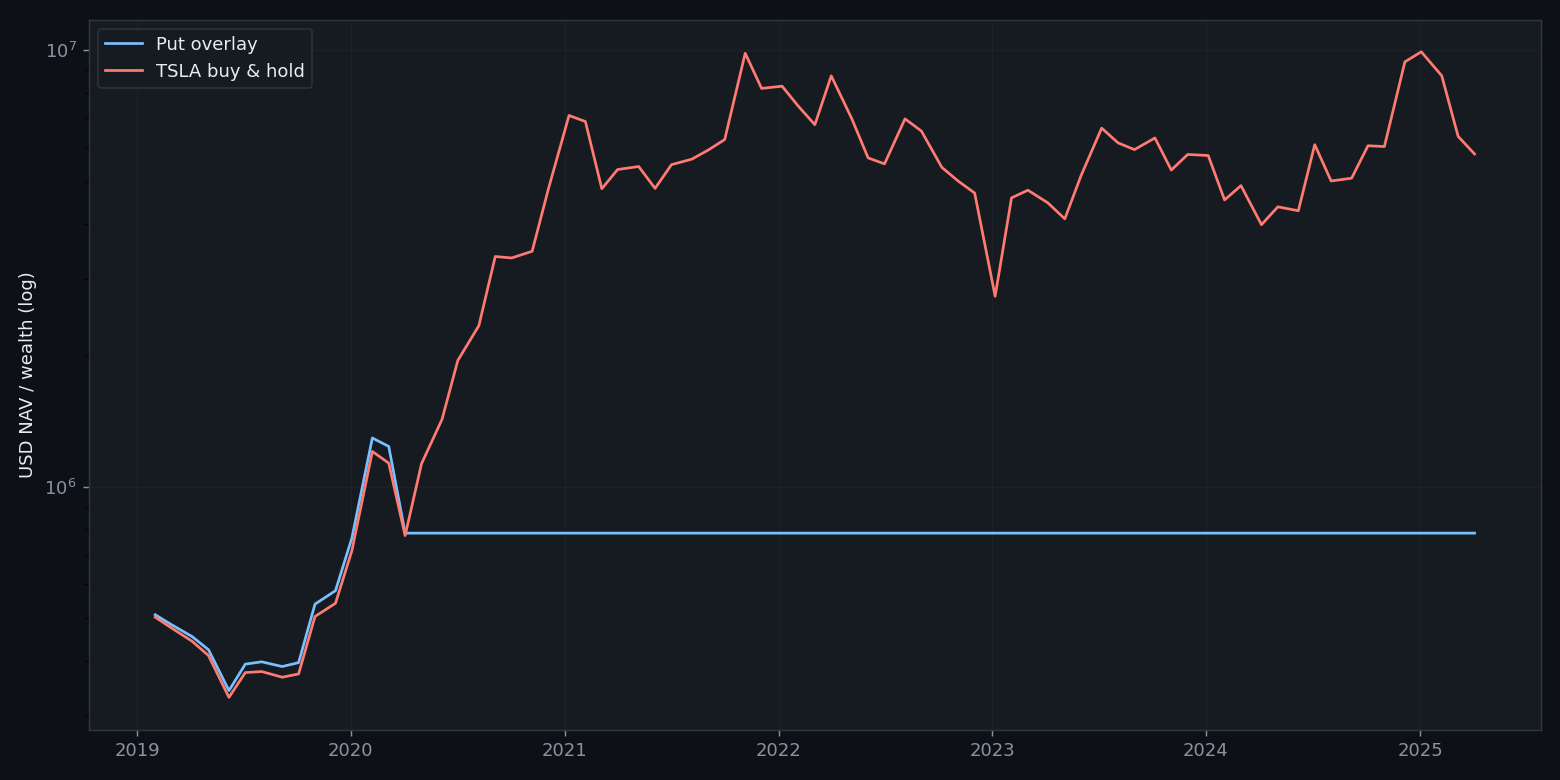
$500k Share-Covered Overlay
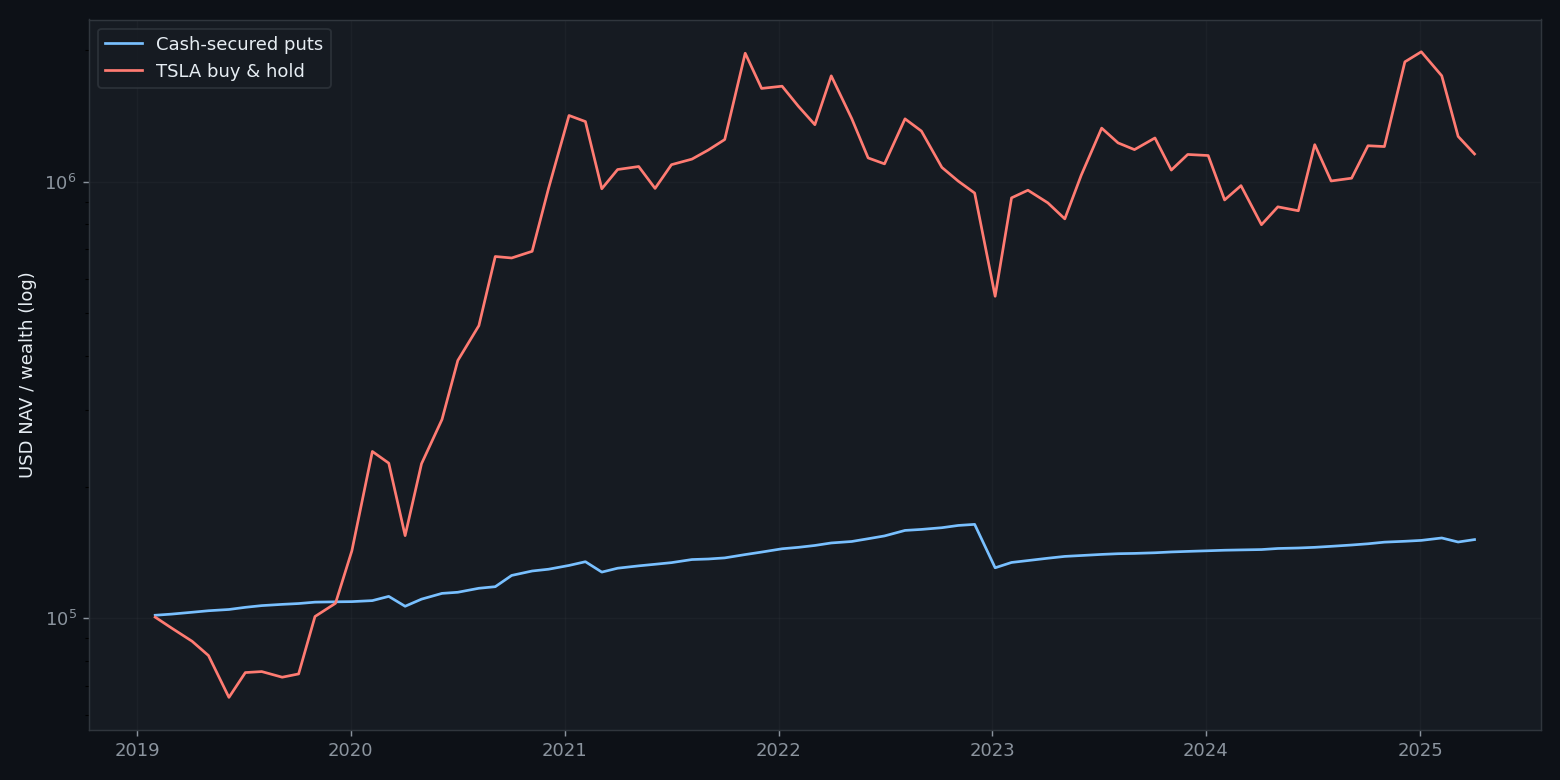
$100k Max Cash-Secured Put Strategy
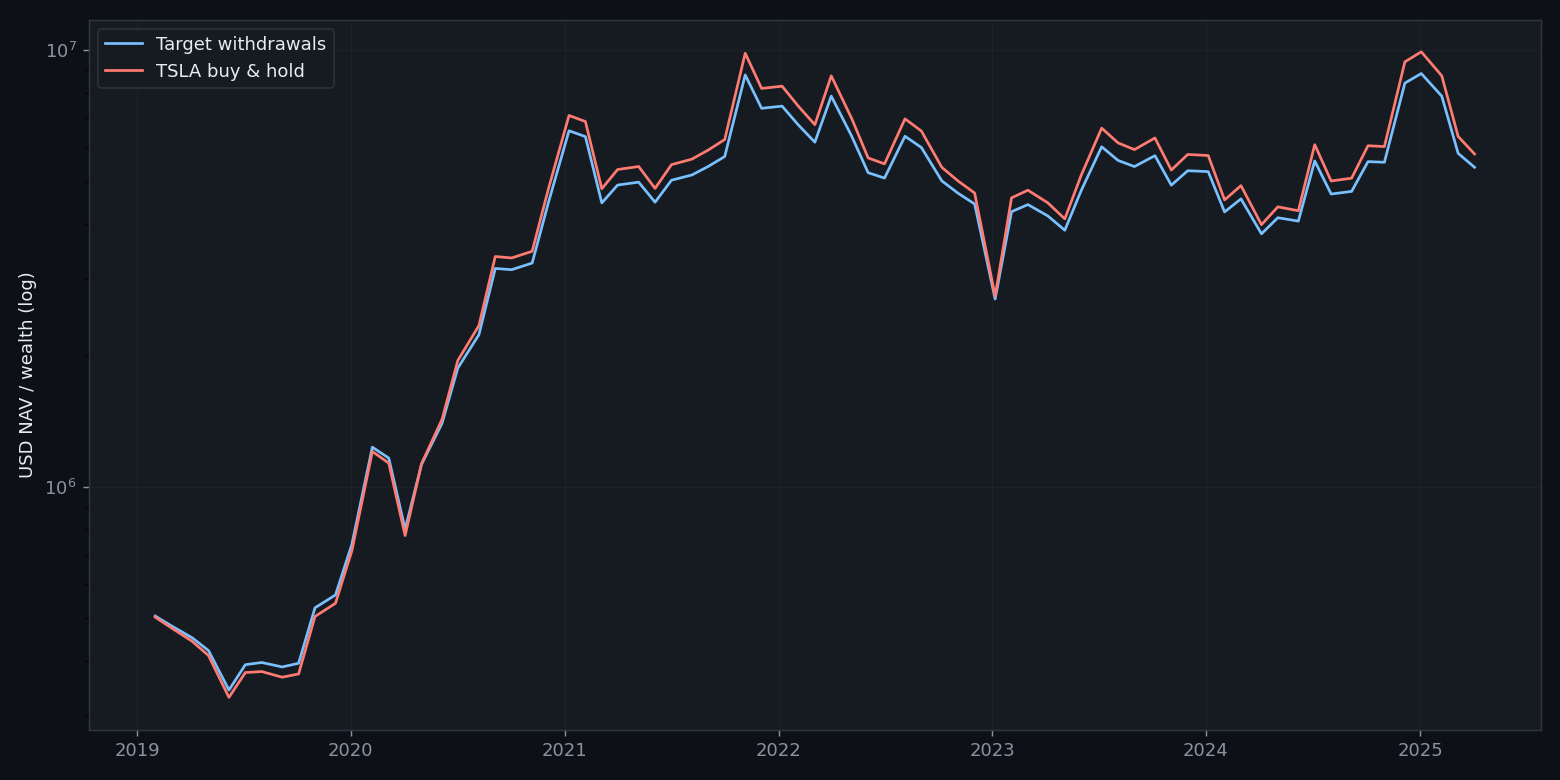
$500k Target-$3k Withdrawals
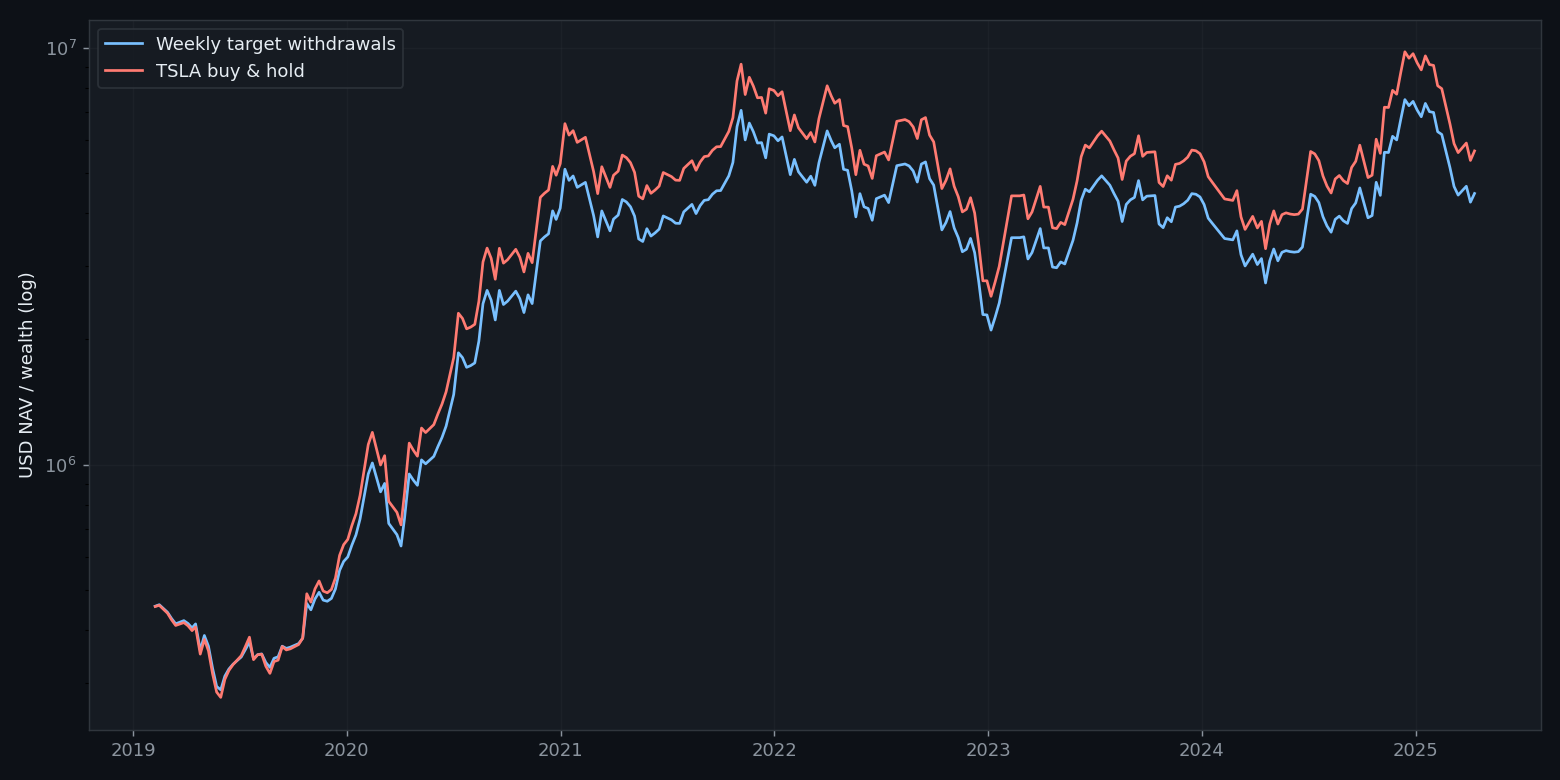
$500k Weekly Target-$750 Withdrawals
Output Data
The full trade ledgers are written beside this report as monthly_put_trades.csv, monthly_put_500k_overlay.csv, monthly_put_100k_cash_secured.csv, monthly_put_500k_target3k_withdrawal.csv, monthly_put_500k_stock_sale_3k_withdrawal.csv, monthly_put_500k_weekly_target750_withdrawal.csv, and monthly_put_500k_weekly_stock_sale_750_withdrawal.csv.