Call Shape Optimization - Extended Data
This report asks whether the original winner still works when the exact rule is frozen and tested on the newly restored options history before and after the period used to choose it.
Yes: it worked spectacularly only inside the limited, searched timeframe.
The original report correctly showed an enormous historical win from 2019 through April 2025. But that rule lost almost everything in the added 2014-2018 history and lost money again after April 2025. The old result is now best understood as a regime-specific in-sample discovery, not a reliable investing rule.
Original conclusion vs extended conclusion
Original Call Shape Optimization
Period: January 2019-April 2025.
Process: searched many expiries, strikes, exposures, take-profit rules, and filters, then selected the best compromise inside that history.
Published outcome: $305,346,193 from $100,000 versus $1,220,188 for TSLA, before executable-fill costs; max drawdown -80.60%.
Then-current conclusion: primary pick for compounding.
Extended-data validation
Period: June 2014-July 2026, split so the rule starts fresh before, during, and after the searched period.
Process: froze the already selected rule before reading extension outcomes; added costs, TSLA, QQQ, liquidity, mark-quality, and reconciliation checks.
Outcome: $1,666 before 2019 and $55,635 after April 2025, from $100,000 each.
Updated conclusion: failed validation; do not use as an investable strategy.
What changed? Not the rule. The evidence changed. The original period included the exceptional 2020, 2023, and 2024 upside bursts that long OTM calls need. The added periods show what happens when those bursts do not arrive often enough: repeated premium decay overwhelms the occasional winner.
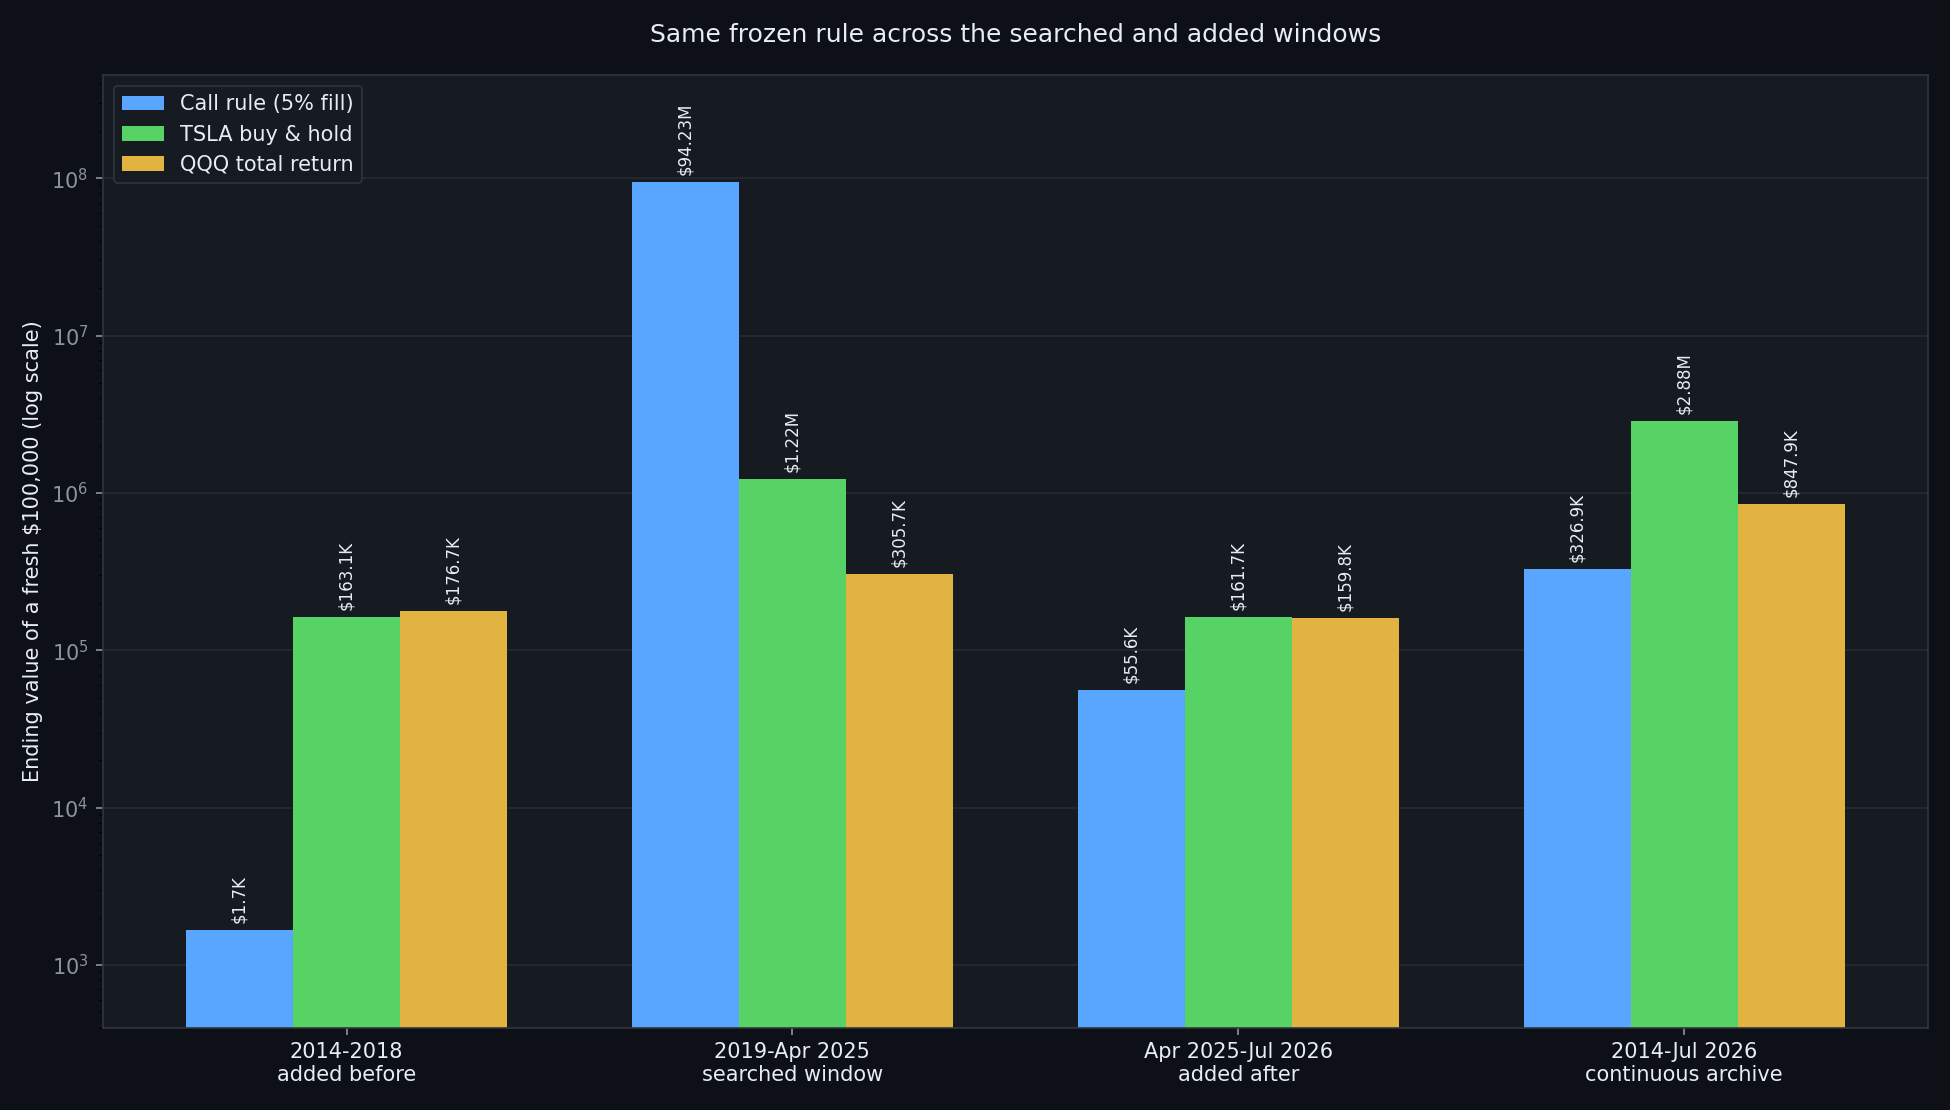
Same frozen rule, different windows
Every row below starts with a fresh $100,000. The call rule uses the registered primary execution assumption: 5% adverse fill plus $0.65 per contract. The continuous archive is also a single uninterrupted 2014-2026 path, so it should not be added to the three fresh-start windows.
| Evidence window | Dates | Call rule | Return | Max DD | TSLA | QQQ | Read |
|---|---|---|---|---|---|---|---|
| Added before | Jun 2014-Dec 2018 | $1,666 | -98.33% | -98.98% | $163,143 | $176,730 | FAIL |
| Original searched era | Jan 2019-Apr 2025 | $94,225,428 | 94,125.43% | -83.59% | $1,220,188 | $305,661 | IN-SAMPLE WIN |
| Added after | Apr 2025-Jul 2026 | $55,635 | -44.36% | -72.53% | $161,748 | $159,835 | FAIL |
| Continuous archive | Jun 2014-Jul 2026 | $326,860 | 226.86% | -99.58% | $2,875,468 | $847,936 | BEHIND TSLA |
Full 2014-2026 continuous NAV curve
This is the all-years version of the NAV curve from the original optimization report. It starts once in June 2014 and never resets. The frozen rule, TSLA, QQQ, and cash therefore carry the same original $100,000 through the complete archive.
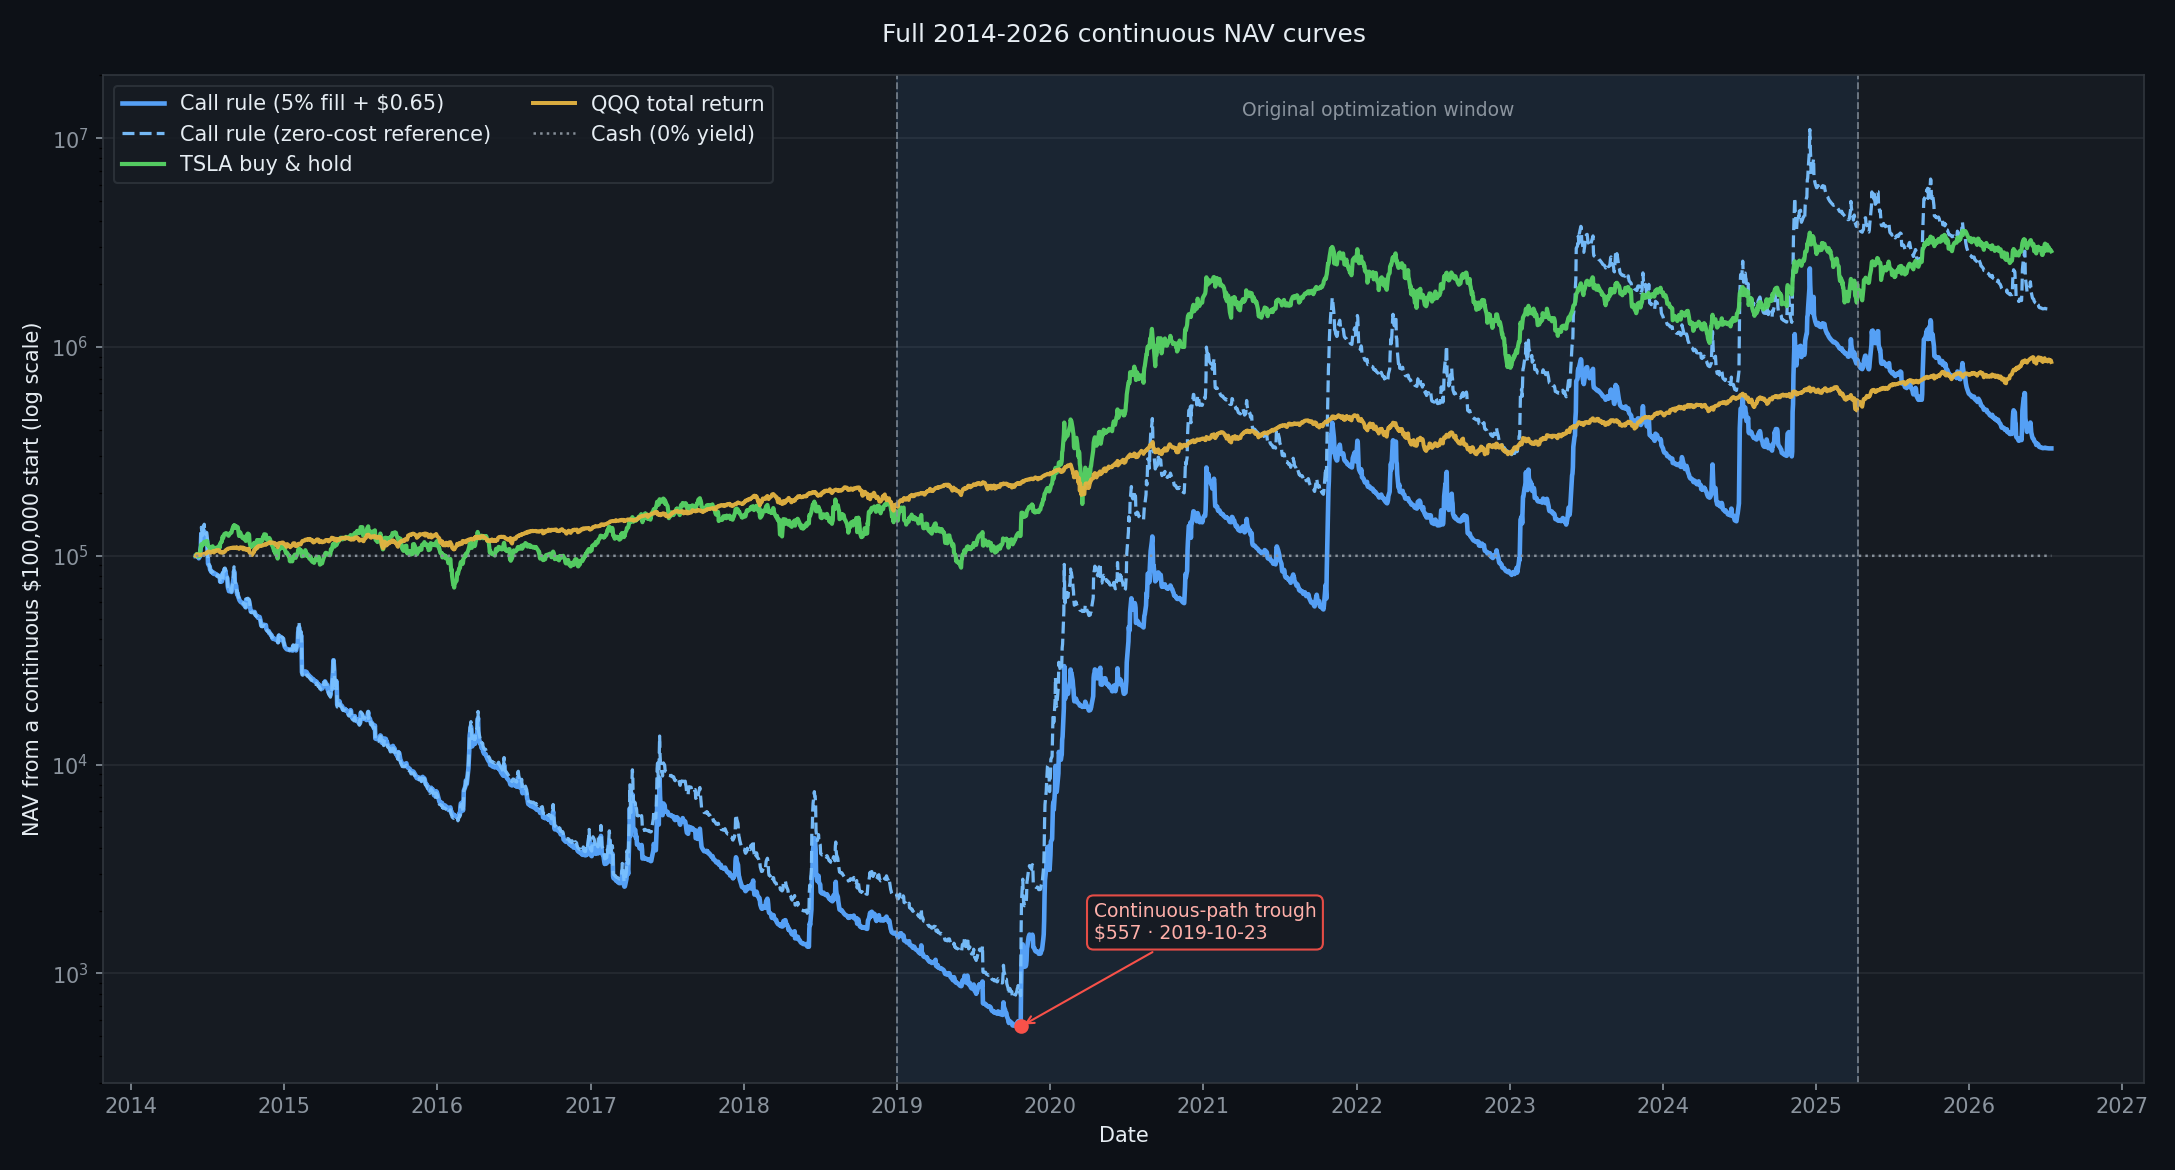
Why this curve matters: the original report restarted January 2019 with a fresh $100,000. The continuous all-years path entered that period with most of its capital already gone. It eventually recovered, but its -99.58% maximum drawdown and lower ending wealth than TSLA make the path unusable as a durable compounding strategy.
Year-by-year: where the strategy actually worked
On fresh calendar-year starts at the primary cost, the rule beat TSLA in 6 of 13 reported years (6 of 11 complete years) and QQQ in 5 of 13. Its wins cluster in 2019-2024; it lost to both benchmarks in 2015-2018, 2025, and the partial 2026 sample. The original report's 81.82% figure used eleven overlapping calendar and July-to-June windows only inside 2019-2025, so it is not the same diagnostic as this expanded calendar-year table.
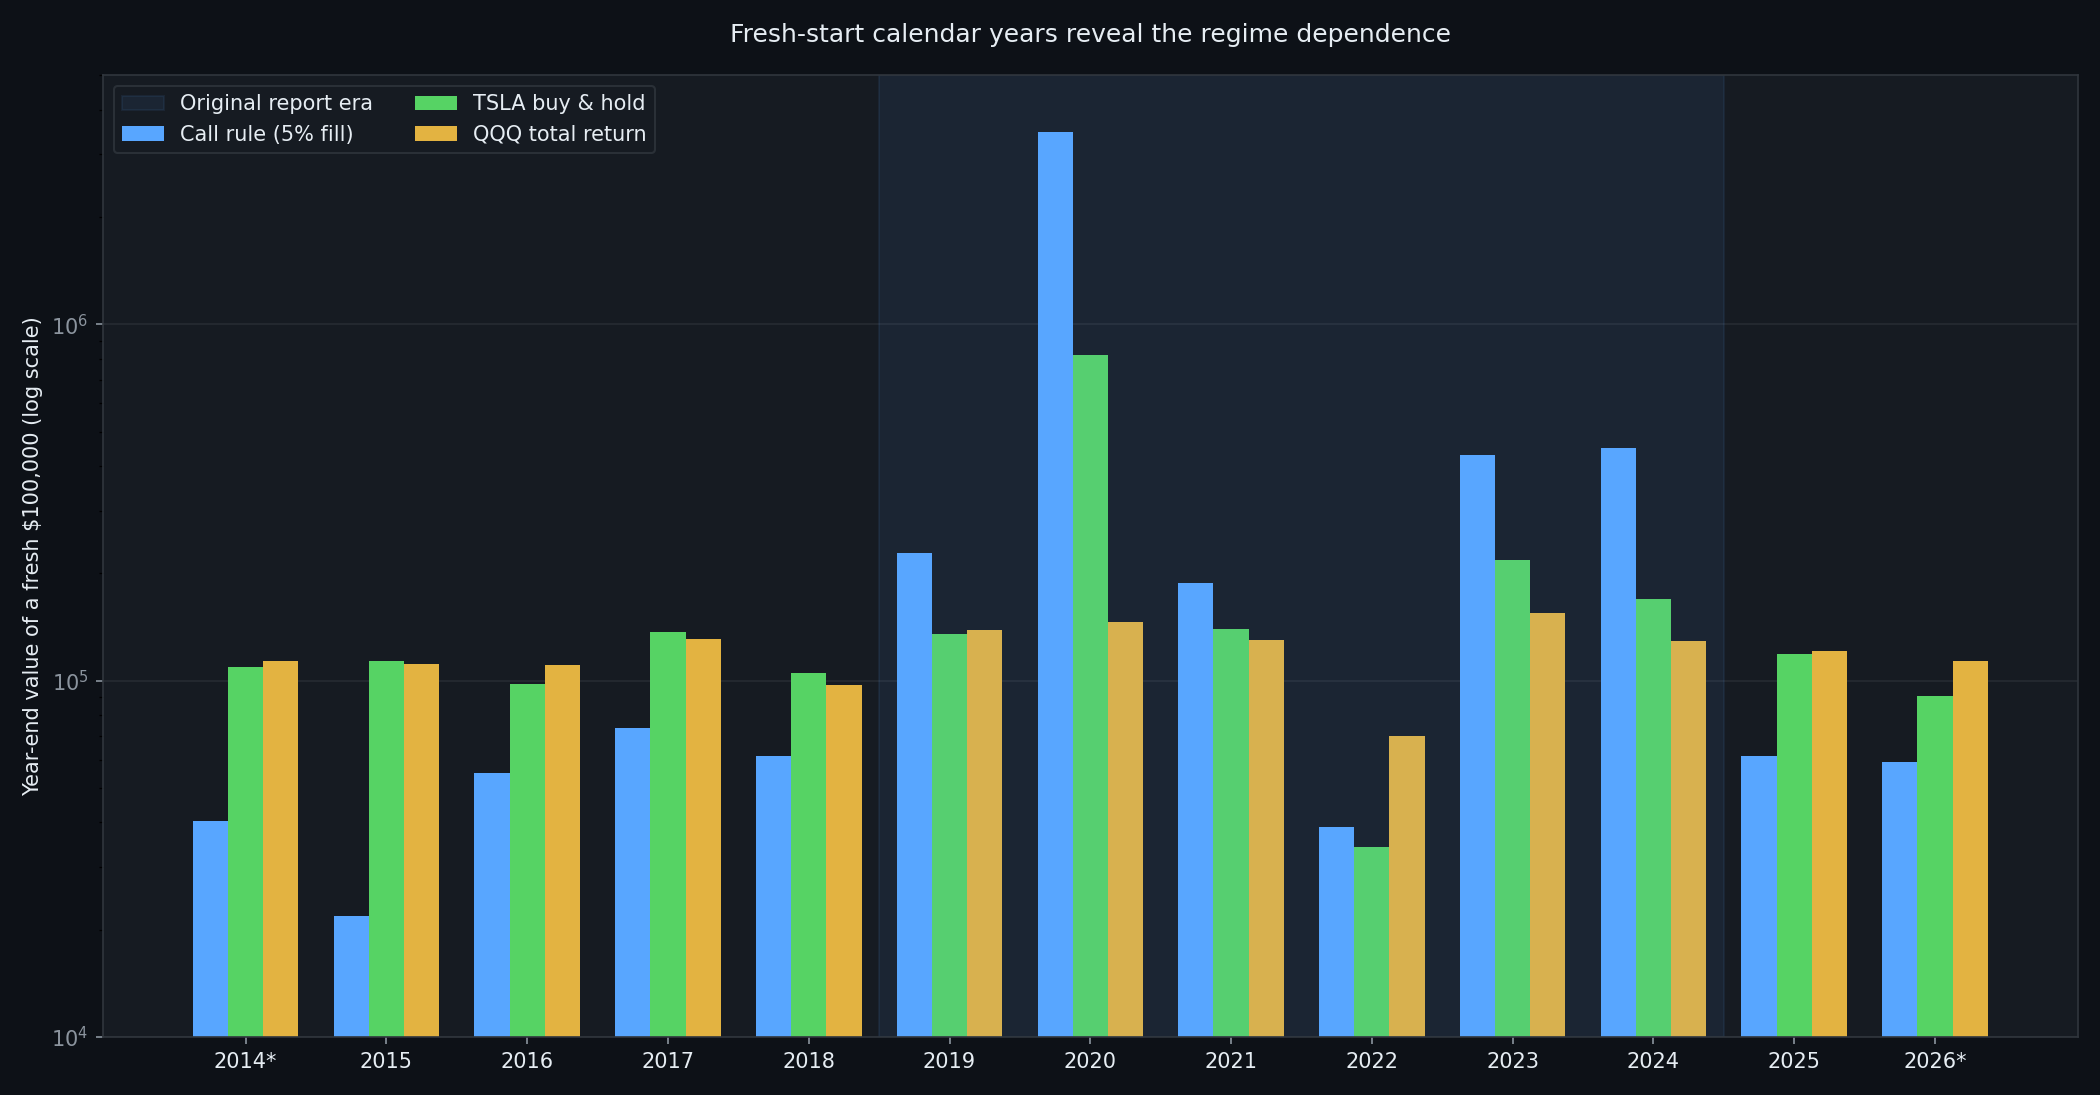
| Year | Call rule | Return | Max DD | TSLA | QQQ | vs TSLA | vs QQQ |
|---|---|---|---|---|---|---|---|
| 2014 (partial) | $40,422 | -59.58% | -69.16% | $109,029 | $113,801 | LOSS | LOSS |
| 2015 | $21,863 | -78.14% | -83.44% | $113,774 | $111,480 | LOSS | LOSS |
| 2016 | $55,034 | -44.97% | -78.81% | $97,558 | $110,655 | LOSS | LOSS |
| 2017 | $73,425 | -26.57% | -68.41% | $137,163 | $130,776 | LOSS | LOSS |
| 2018 | $61,272 | -38.73% | -70.53% | $104,901 | $97,223 | LOSS | LOSS |
| 2019 | $228,226 | 128.23% | -74.00% | $134,887 | $138,364 | WIN | WIN |
| 2020 | $3,466,991 | 3,366.99% | -55.03% | $819,996 | $146,116 | WIN | WIN |
| 2021 | $187,391 | 87.39% | -70.17% | $139,706 | $129,974 | WIN | WIN |
| 2022 | $38,884 | -61.12% | -76.59% | $34,130 | $69,826 | WIN | LOSS |
| 2023 | $430,561 | 330.56% | -59.98% | $218,524 | $155,122 | WIN | WIN |
| 2024 | $448,986 | 348.99% | -52.02% | $169,298 | $129,099 | WIN | WIN |
| 2025 | $61,420 | -38.58% | -51.49% | $118,526 | $120,896 | LOSS | LOSS |
| 2026 (partial) | $59,267 | -40.73% | -40.89% | $90,679 | $113,373 | LOSS | LOSS |
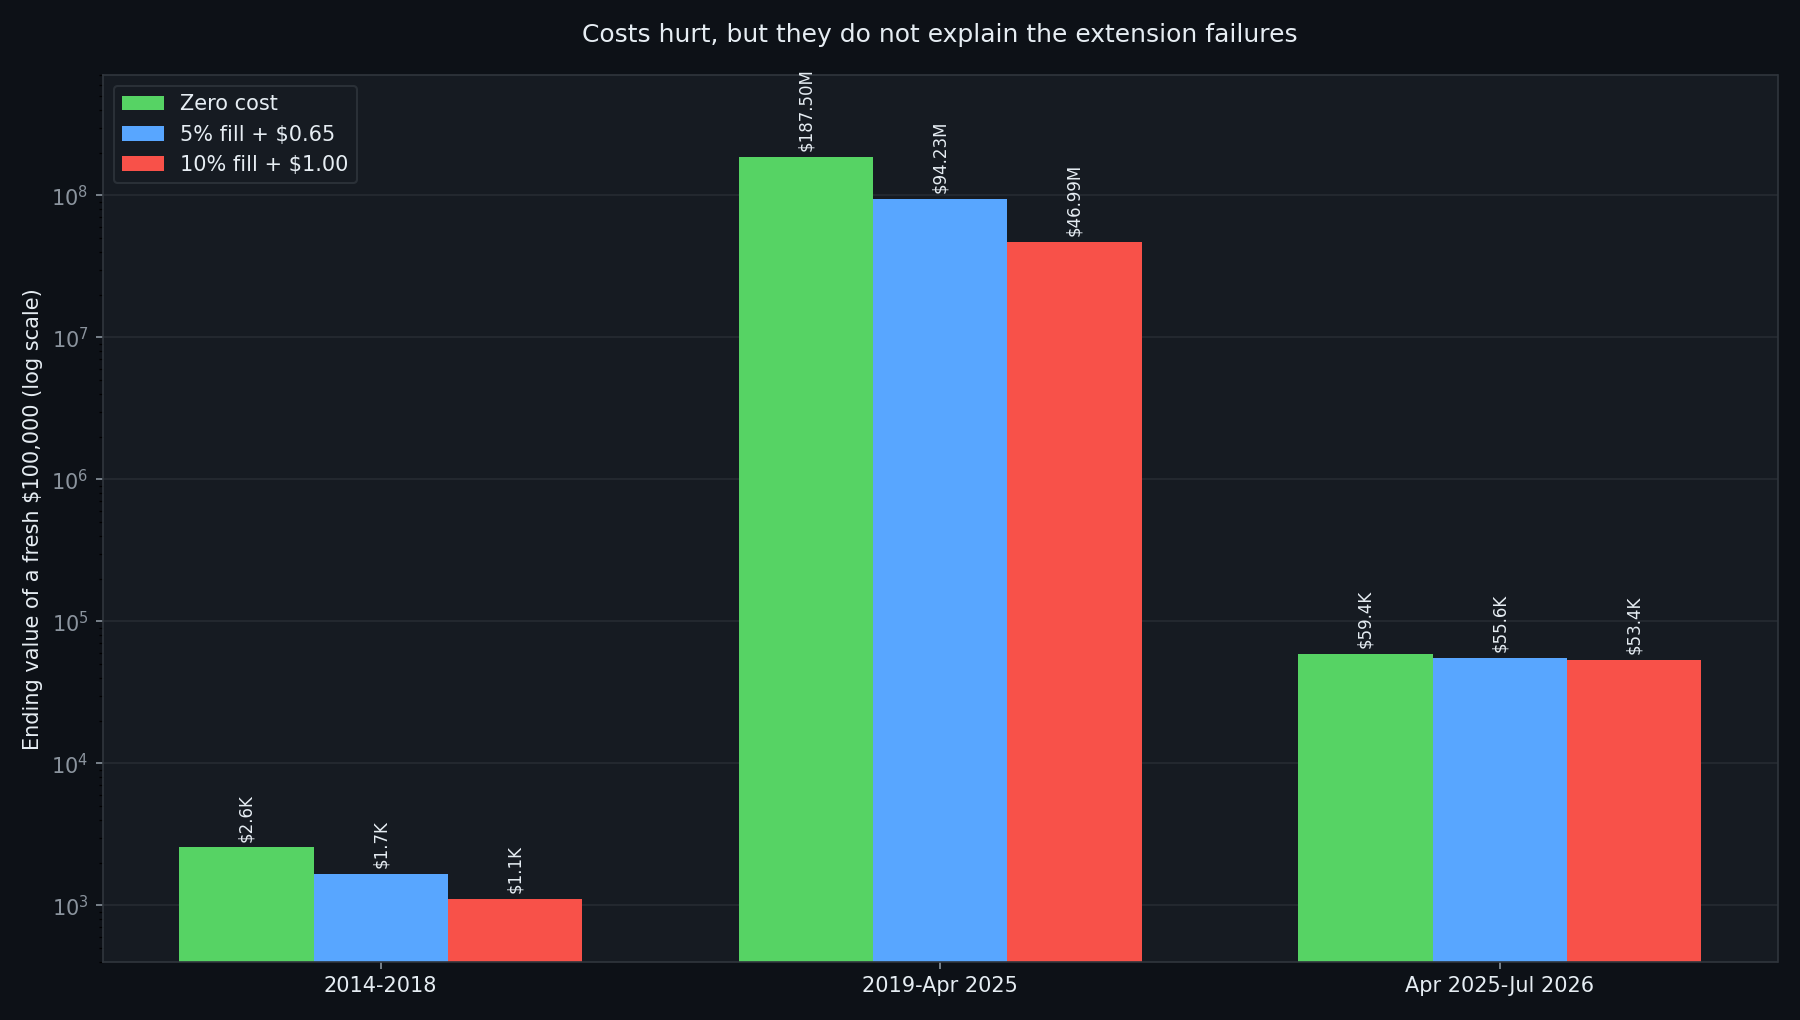
It is not just transaction costs
The rule still failed both added windows under the generous zero-cost reference. Costs make the losses worse, but removing them does not restore the claimed edge.
| Window | Zero cost | 5% fill + $0.65 | 10% fill + $1 | TSLA |
|---|---|---|---|---|
| Jun 2014-Dec 2018 | $2,561 | $1,666 | $1,110 | $163,143 |
| Jan 2019-Apr 2025 | $187,496,077 | $94,225,428 | $46,994,668 | $1,220,188 |
| Apr 2025-Jul 2026 | $59,395 | $55,635 | $53,434 | $161,748 |
Does the new options source reproduce the original?
Mostly, once the published purchase dates are held fixed. The archive covered 99.9958% of the original chain rows, agreed on the selected contract 99.75% of comparable days, and had a 0.00% median selected-premium difference.
| 2019-April 2025 comparison | Final NAV | Difference vs published | Meaning |
|---|---|---|---|
| Original published path, zero cost | $305,346,193 | — | Result shown in the original report |
| New source, forced to published buy dates | $291,957,372 | -4.38% | Prices and contract selection reproduce closely |
| New source, natural code-faithful calendar | $187,496,077 | -38.60% | More complete quote dates change the weekly path |
| New source, natural calendar + primary costs | $94,225,428 | not comparable | Adds the registered 5% adverse fill and commission |
Why the natural path differs: the old engine scheduled the next purchase seven days after the last executed purchase. Missing quote dates therefore moved the weekday permanently. Only 38.72% of natural buy dates overlapped, with the first divergence at origin=2021-01-07; lab=2021-01-04. This is path fragility, not evidence that the original arithmetic was fabricated.
Could a nearby original finalist rescue it?
No. The three previously named alternatives were allowed only as frozen robustness controls. Every one failed both added windows; no new parameter was searched and no favorable neighbor replaced the primary rule.
| Previously named finalist | 2014-2018 NAV | Max DD | 2025-2026 NAV | Max DD | Result |
|---|---|---|---|---|---|
| 12.5% / trim 25% every +2000% | $1,666 | -98.98% | $55,635 | -72.53% | FAIL |
| 15% / trim 25% every +2000% | $630 | -99.61% | $45,092 | -79.01% | FAIL |
| 12.5% / trim 15% every +2000% | $1,420 | -99.02% | $55,635 | -72.53% | FAIL |
| 12.5% / trim 25% every +3000% | $1,116 | -99.15% | $55,635 | -72.53% | FAIL |
Rare-win dependence and real-world capacity
The original path compounded to a size that was not realistically scalable in the recorded contracts. Daily OPRA aggregates report trades, not executable bid/ask depth, so even the adverse-fill rows remain assumptions rather than proof of obtainable fills.
What was validated—and what was not
- Frozen rule: weekly TSLA calls nearest 30 days and 20% OTM; four overlapping 3.125%-of-NAV purchases target 12.5% premium exposure; trim 25% of remaining whole contracts at each additive +2,000% threshold.
- Independent data: 3,046,859 standard-root TSLA call rows across 3,052 daily option files, June 2014-July 2026.
- Benchmarks: TSLA buy-and-hold, dividend-reinvested QQQ, and zero-yield cash.
- Verification: all 43 artifact, identity, hash, and verdict checks passed. That verifies the backtest's internal result; it does not validate the strategy.
- Important limit: the added periods were unused by the original optimizer, but they were historical—not prospectively sealed. A pass would only have been a research lead. The clear failure is still strong evidence against the rule.
- Outside scope: taxes, FX, Swedish account rules, broker exercise handling, live bid/ask depth, and Treasury yield on collateral cash.
Updated decision
Keep the original report as a record of discovery, not as the plan.
The strategy did beat TSLA by an extraordinary amount in the selected 2019-April 2025 history. It did not demonstrate a durable edge across the longer archive. The independent market lab therefore rejected it, and no portfolio candidate was exported.