TSLA Strategy Analysis
Lever-by-lever walkthrough. Each chapter: insight + verifiable deep-dive link. Rationale: analysis/PROCESS.md.
Goals this analysis serves
Priority order — hard constraints first.
- Hard: no plausible wipeout. In ANY adverse regime (long flat/chop included). Stock = safe (Tesla survives). X3 = wipeout-able (chop + decay → zero, even with MA10 gate). Must structurally bound: cap wipeout-able fraction OR hedge with untouched safe sleeve. Disqualifies strategies that look great on historical NAV/DD.
- Pick one to live with for years (regime overrides allowed).
- Floor: $3K/mo withdrawal sustained across plausible regimes.
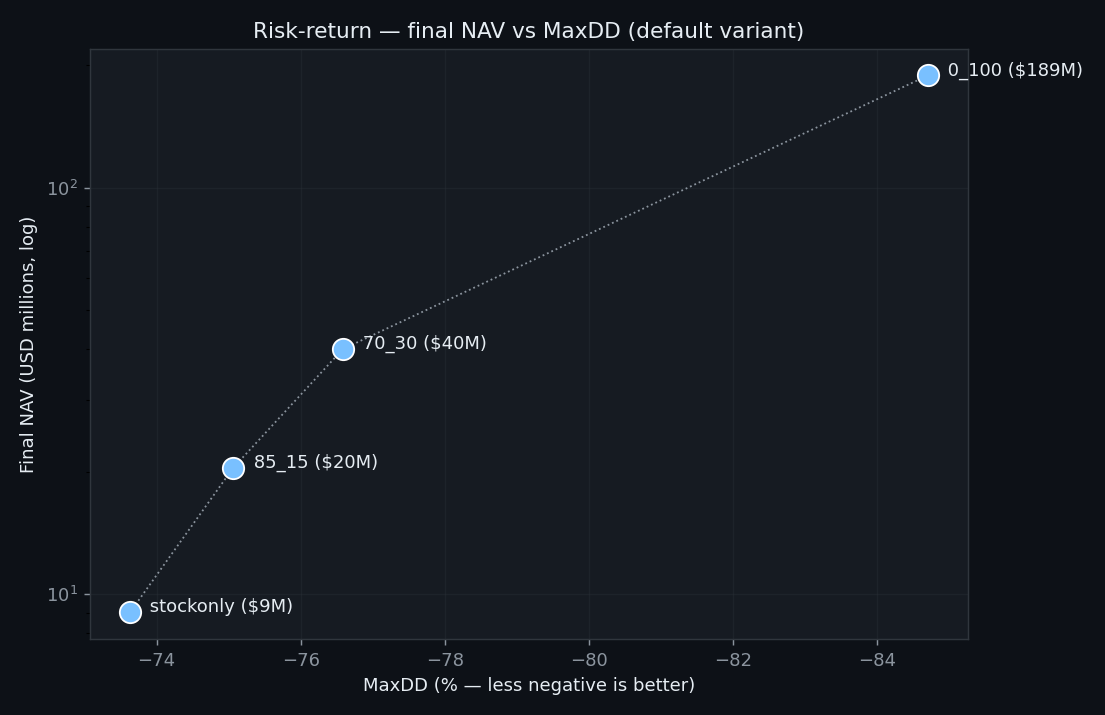
- Optimize: max NAV, min MaxDD.
Status: wipeout constraint applied. 2.5 quantifies the tail (10% of forward 24m windows lose >90% of X3 at TSLA's median behavior; 30–60% under chop). Numbers per 2026-05 X3 recalibration (drag 0%, epsilon floor).
Validation status
X3 Phase 1 validation is substantially complete. The Avanza MA Strategy account replay matched the latest manual Avanza NAV checkpoint within 0.84% after accounting for Swedish-morning / intraday certificate trade timing from avräkningsnotor.
Interpretation: this validates the synthetic X3 model used below. The strategy comparisons are still rule-based synthetic backtests, not replays of Yusuf's actual Avanza trade history.
Scope & key modeling assumption
Chapters 1.1-1.8 are now pure strategy-mechanics tests. The rows below use no per-cycle withdrawal overlay unless a later section explicitly says otherwise.
The $3K/cycle living-expense overlay is deferred. It is still an important constraint for the final portfolio design, but it is no longer mixed into the lever-by-lever comparisons.
Corrected collar accounting changed the shortlist. The previous stock-only collar anchor no longer works after fixing double-counted covered-call premium. Chapters 1.5-1.8 now reflect the corrected pure model.
Section 1 · Levers
One-knob comparisons. Each chapter: 2–3 strategies differing by one lever, mechanism, deep-dive link.
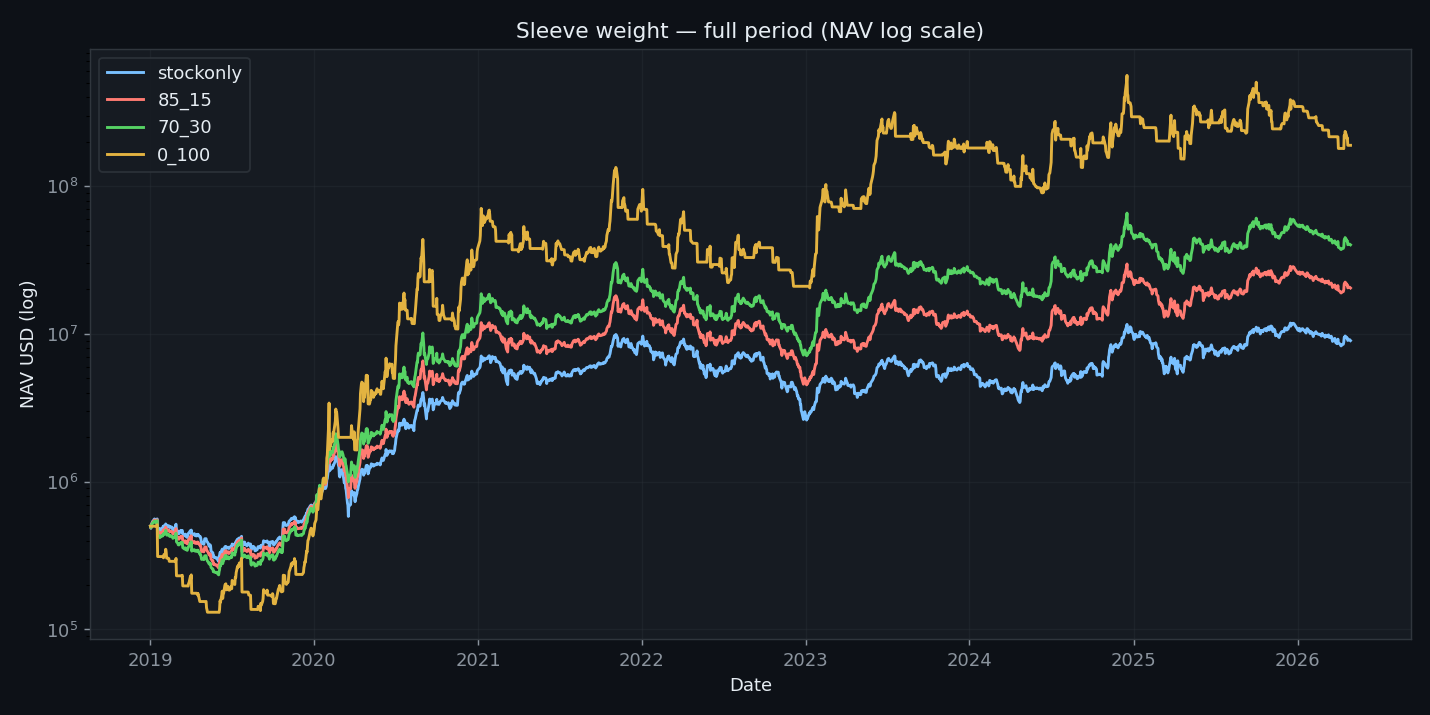
1.1 · X3 weight (0 / 15 / 30 / 100%)
X3 = leveraged 3× TSLA, MA10-gated (exits when close < 10d MA). Not raw 3× — gate avoids worst bear legs. Model also exits flat on TSLA quarterly-earnings days and re-enters at next-day open (added 2026-05-10) — matches Yusuf's live behavior, avoids ±45% single-day swings the MA10 gate can't.
Why X3 wins here:
- TSLA ~50% CAGR / 7yr → leverage amplifies more than it damages.
- MA10 gate (now plus earnings exit) limits 2022 sleeve drawdown to ~−83%, not −99% raw 3×.
- X3 gated exit + 2023 bounce recovery > bear pain.
- 2026-05 calib: rate-aware synthetic X3, no annual drag overlay, and quarterly-earnings exit. 0_100 now lands at $688M (previous chapter number was $848M before the final validated X3 refresh).
Would flip in:
- Range-bound TSLA: MA10 whipsaws death-by-1000-cuts, no bull to compensate.
- Slow grinding bear: late gate exits → cumulative X3 losses dominate.
- Neither in 2019–2026 data — claim scoped.
stockonlydominated by85_15.85_15dominated by70_30(~58% less NAV for ~1.7pp DD — bad trade).- Without protection:
70_30vs0_100. - Corrected collar note: the old Section 2 collar-dominance read is invalid after the premium-funding fix.
0_100remains the raw-NAV ceiling; collar rows are now drawdown-control candidates with explicit NAV cost.
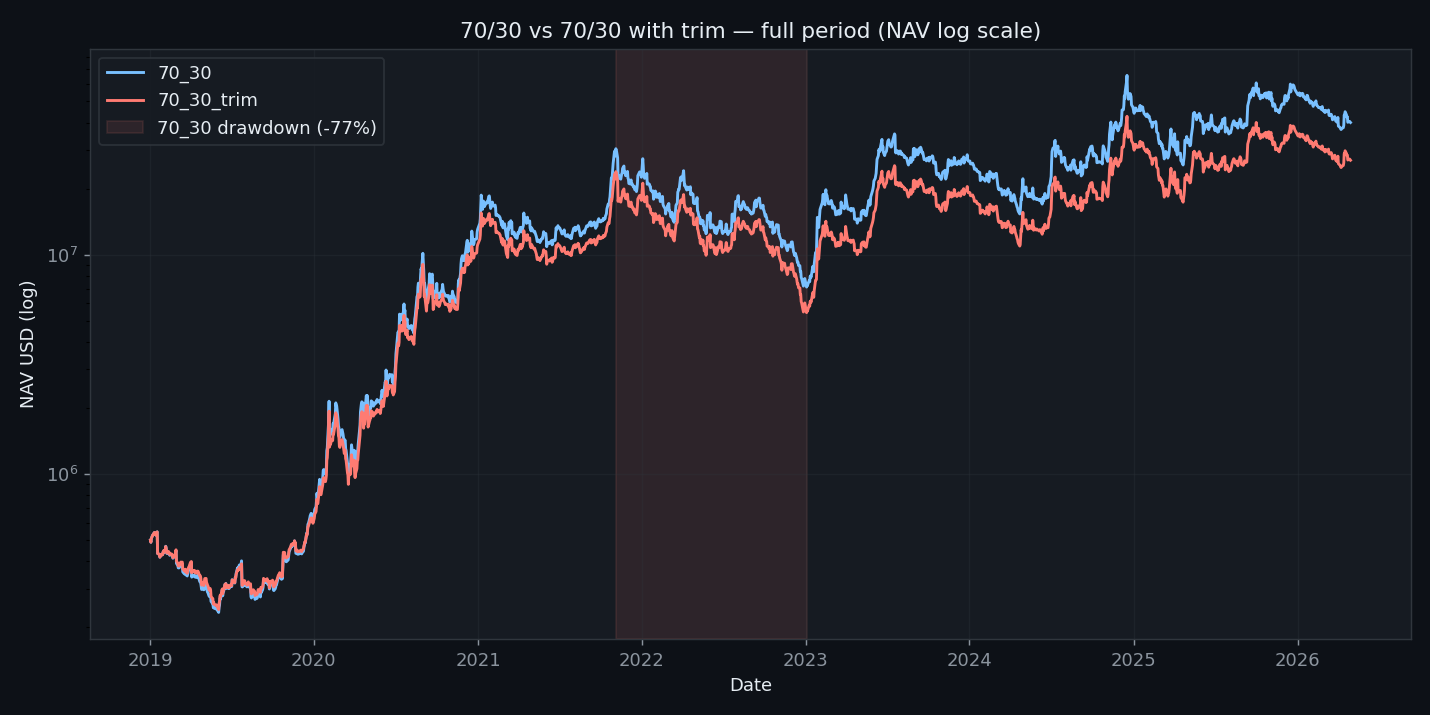
1.2 · Trim X3 (on / off)
Trim = move X3 above-target gains → stock; never refill from stock. Pitch: lock bull gains, don't add to falling X3.
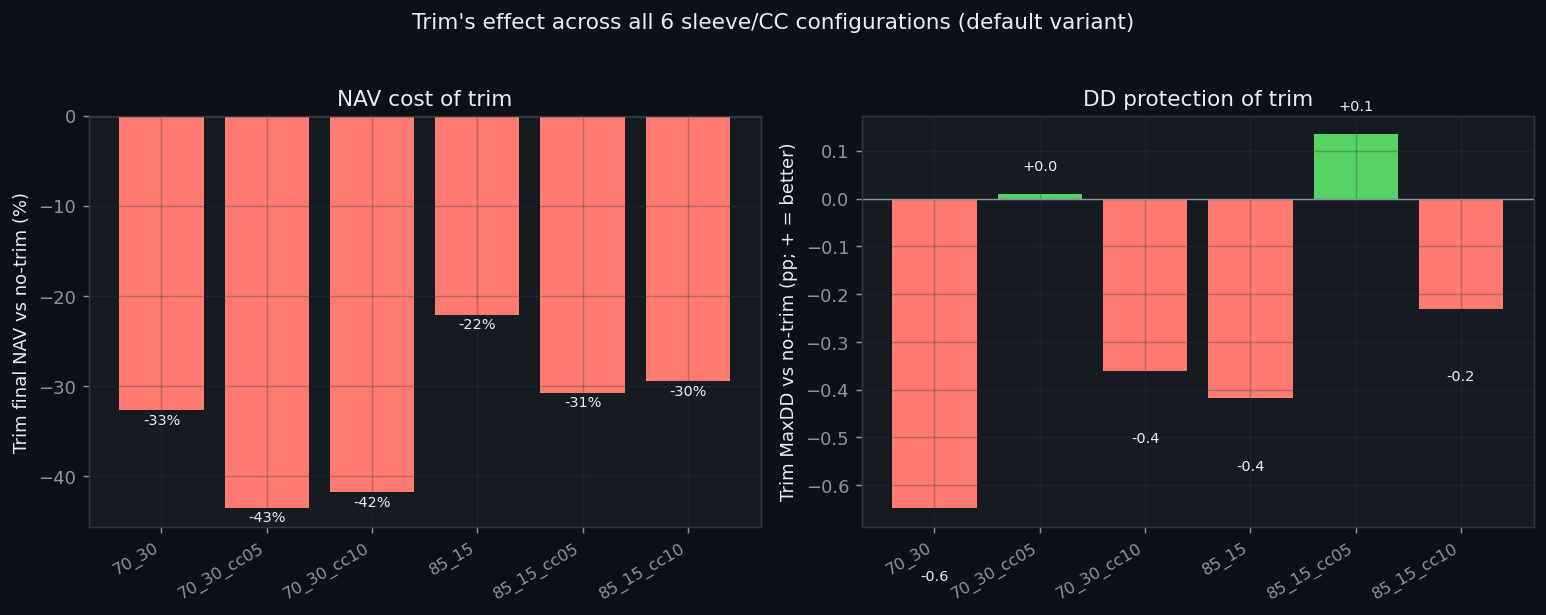
- NAV cost: still large across the tested pairs (default variant)
- DD penalty: trim still has worse DD than no-trim in the 70/30 bare pair. Trim doesn't even achieve the DD protection it was designed for.
Why DD protection fails:
- Trim resets X3 to target, never below. Peak X3 weight = no-trim peak X3 weight.
- Trimmed gains → stock, not cash. Stock fell ~70% in 2022 alongside X3.
- Net: same peak exposure, ~same DD%, less bull compounding.
Hypothesis tested: does trim win in chop?
Intuition: X3 underperforms TSLA most in moderate-down / sideways cycles (MA10 whipsaw + daily-reset decay). Symmetric refills X3 from stock every cycle → drains stock. Trim freezes X3 at post-bleed level → isolates damage.
Where X3 trails TSLA most (per-cycle, full window):
| TSLA cycle bucket | n | TSLA | X3 sleeve (med) | X3 − TSLA |
|---|---|---|---|---|
| −7.5% to −2.5% | 13 | −4.6% | −17.9% | −13.3pp |
| +2.5% to +7.5% | 13 | +4.9% | −3.7% | −8.6pp |
| −2.5% to +2.5% | 8 | +0.2% | −5.9% | −6.1pp |
| −12.5% to −7.5% | 9 | −9.4% | −9.9% | −0.5pp |
Chop band ≈ TSLA cycle returns −7.5% to +7.5% — where X3 bleeds vs stock.
Test: 70_30 vs 70_30_trim on chop-heavy sub-periods (40–46% in chop band):
| Sub-period | % chop-band | no-trim NAV | trim NAV | no-trim DD | trim DD | trim wins? |
|---|---|---|---|---|---|---|
flat_2021_06_to_2023_06 | 46% | $0.92M | $0.73M | −74.8% | −76.9% | no |
flat_2022_08_to_2025_08 | 46% | $1.06M | $0.92M | −60.8% | −62.0% | no |
bad_x3_2021_11_to_2023_06 | 40% | $0.53M | $0.45M | −74.7% | −76.8% | no |
bad_x3_2023_07_to_2024_09 | 40% | $0.48M | $0.45M | −56.4% | −56.9% | no |
multi_oscillation_2023_07_to_2025_07 | — | $0.59M | $0.53M | −59.7% | −59.3% | tie DD, lose NAV |
Same pattern on 85_15/85_15_trim. Best DD edge for trim across 28 sub-periods × 2 sleeves: ~1pp. NAV cost: −6 to −15%.
Why trim loses in chop:
- "Chop" sub-periods aren't pure — they contain up-spikes (TSLA +10–25% → X3 +25–43%).
- Symmetric refill keeps X3 primed for the next spike. Trim shrinks X3 → undersized when spike arrives.
- Missed up-spike compounding > modest DD protection.
- Caveat: 40–46% chop, not 100%. Pure-chop multi-year regime never observed in TSLA. Directional evidence uniform across 8 sub-periods × 2 sleeves → robust.
Verdict: trim dominated by no-trim across full window AND every chop-heavy sub-period. Hypothesis rejected.
Why doesn't no-trim lose much more than stockonly in 2022?
X3 sleeve fell 83%; no-trim 70/30 fell 75% — barely worse than stockonly's 74%? Because TSLA itself fell 74%. All peaked 2021-11-04, bottomed 2023-01-03:
| Strategy | Peak NAV (2021-11-04) | Trough NAV (2023-01-03) | DD |
|---|---|---|---|
stockonly | $9.9M | $2.6M | −74.2% |
85_15 | $20.9M | $5.2M | −75.2% |
70_30 | $40.1M | $9.3M | −76.9% |
70_30_trim | $32.0M | $7.2M | −77.6% |
0_100 (X3 sleeve only) | $315M | $46M | −86.5% |
Two reasons no-trim 70_30 only loses 75%:
- Weighted-average: 70% × −74.2% + 30% × −83.3% ≈ −77.0% (= what trim_only delivers — no rebalance benefit).
- Up-spike capture during the fall: 14-month DD contained 3 violent spikes — Mar 2022 (TSLA +29%, X3 +67%), Jul 2022 (TSLA +27%, X3 +44%), Jan 2023 (TSLA +68%, X3 +251%). Symmetric refill kept X3 loaded for each spike → slowed bleed ~2pp vs naive blend. Trim had smaller X3 → missed recovery → ended at naive-blend DD.
Same mechanism as chop hypothesis, larger scale: any not-pure-fall period → refill compounds up-cycles. Gap small on DD, meaningful on NAV.
Asymmetric deadband mode (trim above X, refill below Y)
Alt: trim X3 above target, refill only when X3 drops well below target. "Best of both" intuition (trim protection most of the time + refill catches crash recovery). sleeve.rebalance_mode: deadband, separate trim_at/refill_at. Tested 4 bands on 70/30 + 1 on 85/15.
| Strategy | Refill trigger | NAV (post-tax) | DD | Sharpe | Refills (88 cycles) |
|---|---|---|---|---|---|
70_30 (symmetric) | every cycle | $60M | −76.9% | 1.18 | 88 |
70_30_band_30_20 | X3 < 20% | $53M | −77.1% | 1.16 | ~30 |
70_30_band_30_15 | X3 < 15% | $46M | −76.0% | 1.14 | 1 |
70_30_band_30_10 | X3 < 10% | $41M | −77.6% | 1.13 | 0 (never triggered) |
70_30_band_30_05 | X3 < 5% | $41M | −77.6% | 1.13 | 0 (never triggered) |
70_30_trim (no refill) | never | $41M | −77.6% | 1.13 | 0 |
Findings:
- Smooth interpolation, no sweet spot. NAV/DD walks smoothly from symmetric to trim_only as band widens.
- Tight bands (15–20%): capture some symmetric NAV upside, DD stays ~−75% (tied with trim).
- Wide bands (5–10%): never triggered — TSLA DDs weren't deep enough 2019–2026. Operationally identical to trim_only.
Trim's structural wipeout protection — and why it still loses
Trim_only is the only single-sleeve mode that structurally protects stock from the X3 sleeve. Symmetric continuously converts stock → bleeding X3. Deadband delays but refills repeatedly once triggered. In sustained-chop wipeout: deadband eats stock, trim doesn't. Trim = asymmetric lock-in at the sleeve level.
Corrected collar read: the old Pick 1 comparison is invalid after fixing collar premium funding. stock_only_collar_05 reduces drawdown but fails the compounding thesis, so the trim chapter no longer uses it as a picks-ladder anchor:
| Strategy | NAV (post-tax) | DD | Sharpe | Wipeout-able fraction |
|---|---|---|---|---|
stock_only_collar_05 (corrected) | $0.65M | -45.3% | 0.19 | 0% X3, but weak compounding |
85_15_trim | $19.5M | −75.7% | 1.02 | 15% |
70_30_trim | $40.2M | −77.6% | 1.13 | 30% |
- Corrected stock-only collar is far below 70_30_trim NAV ($0.37M vs $41.3M pre-tax).
- It still improves drawdown versus bare stock, but the return/Sharpe no longer qualify it as a replacement for trim.
- Mechanism change: CC premium cannot both buy more shares and fund the put. Once that is fixed, put cost plus assignment drag overwhelms the stock-only collar.
Verify in trim_comparison report.
70_30_trim. → 70_30 (no trim): $60M vs $41M, similar DD. Cleanest single-lever change. The old “better: stock-only collar” add-on is removed after the corrected collar accounting.
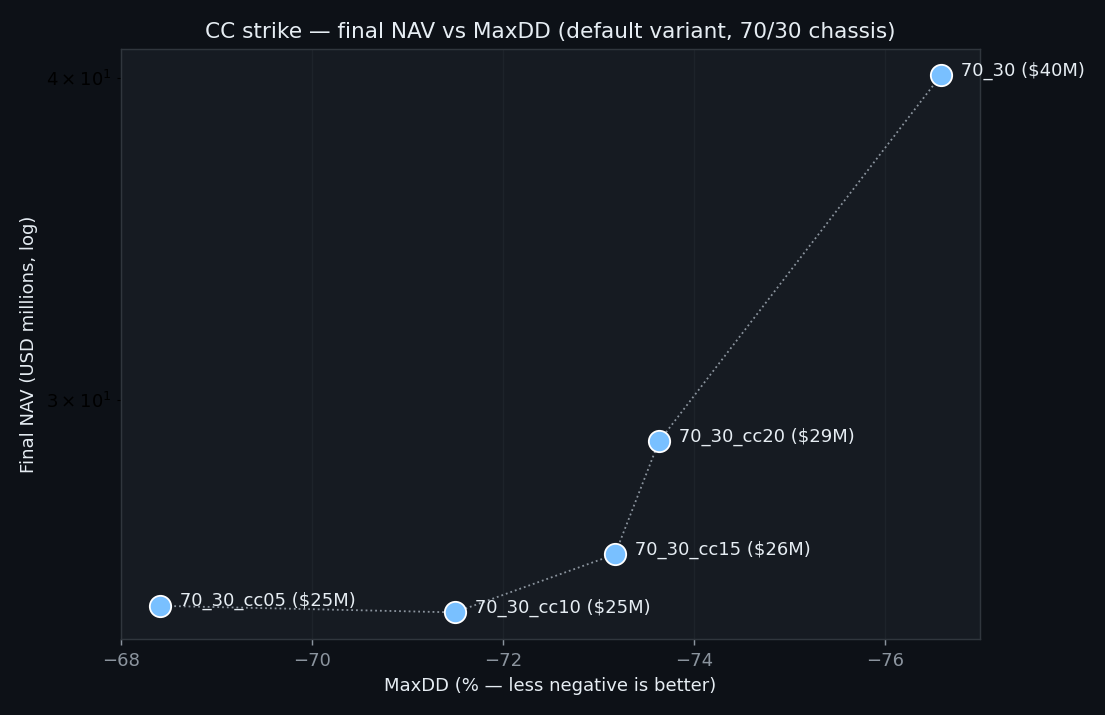
1.3 · CC strike (none / 5 / 10 / 15 / 20% OTM)
70_30 chassis, full coverage. Partial coverage is isolated in 1.4.
| Strategy | Final NAV | Post-tax NAV | MaxDD | Sharpe | Cum. Premium* | Assign% |
|---|---|---|---|---|---|---|
70_30 (no CC) | $59.7M | $58.3M | -76.9% | 1.18 | $0 | n/a |
70_30_cc20 | $43.4M | $42.5M | -73.8% | 1.15 | $13.4M | 20.5% |
70_30_cc15 | $38.9M | $38.1M | -73.5% | 1.14 | $18.0M | 22.7% |
70_30_cc10 | $38.2M | $37.4M | -72.2% | 1.15 | $25.4M | 29.5% |
70_30_cc05 | $38.0M | $37.2M | -68.7% | 1.16 | $37.3M | 38.6% |
Default variant. The best pure CC row by NAV is still wider-strike cc20; cc05 buys the most drawdown relief.
* Cum. Premium is informational only - it is already reflected in NAV.
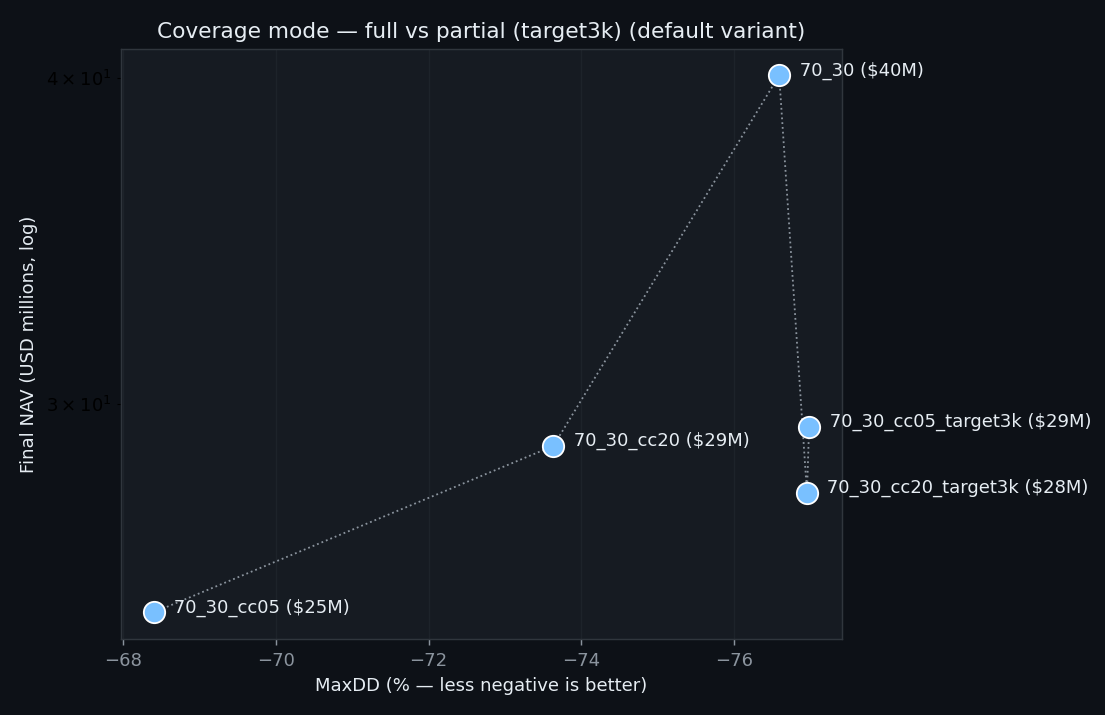
1.4 · Coverage mode (full vs partial)
Same 70_30 chassis and CC strikes, but with full contract coverage versus small fixed-premium targets.
| Strategy | Final NAV | MaxDD | Sharpe | Cum. Premium* | Assign% |
|---|---|---|---|---|---|
70_30 (no CC) | $60M | -76.9% | $0 | ||
70_30_cc05_target3k | $55M | -76.9% | $0.3M | ||
70_30_cc20_target3k | $52M | -76.9% | $0.3M | ||
70_30_cc20 (full) | $43M | -73.8% | $13M | ||
70_30_cc05 (full) | $38M | -68.7% | $37M |
Default variant. Partial cluster on right (DD = no-CC); full cluster on left (DD relief).
* Cum. Premium is informational only — it's already reflected in NAV (see 1.3 footnote).
Mechanism:
- Partial sizes to the fixed premium target → <5% of stock sleeve covered → ~95% of upside retained.
- 2022 bear premium cushion: full cc05 = $37M vs partial = $0.3M. Partial can't soften DD.
- Same strike, same per-contract assignment (~39% at cc05). Partial just writes fewer contracts.
- Among partial:
cc05_target3kbeatscc20_target3kby about $3M (closer-to-money earns more per contract → fewer contracts → less upside given up).
- Among partial CC rows:
70_30_cc05_target3kpreserves the most NAV. - 1.5 extends this: adding puts reduces drawdown further, but at an explicit NAV cost.
1.5 · Puts (on / off, strike) — biggest finding
Corrected 2026-05-14: the old collar chapter was built on a stock-sleeve accounting bug. Covered-call premium was both reinvested into shares and also counted as available cash to buy the protective put. The fixed model keeps the premium in cash when a put is bought, so the put cannot be funded twice. This materially changes every collar conclusion below.
- The old “stock-only collar is Pick 1” conclusion is invalid. Corrected
stock_only_collar_05ends at $0.68M pre-tax / $0.65M post-tax from roughly $0.50M starting NAV, with -45.3% MaxDD and weak Sharpe. It is not a compounding safe anchor. - For 70/30, the tight collar is insurance, not alpha.
70_30_cc05_put05cuts MaxDD from −76.9% to −60.5%, but NAV falls from $59.7M to $15.7M. It wins 14 of 27 preset windows, mostly bear/chop windows, and loses 13, including the full real-options window and strong bull windows. - Wider puts are now better for NAV. Within the 70/30 cc05 ladder,
put15ends highest ($20.1M), thenput10($17.4M), thenput05($15.7M). Tighter puts still reduce drawdown, but the extra protection is too expensive after the double count is removed. - The real trade-off: pay option cost to reduce drawdown, or keep more uncapped TSLA/X3 exposure for NAV. That is a legitimate risk choice, but not the previous “free collar” result.
| Strategy | NAV | Post-tax NAV | MaxDD | Sharpe | Put cost / payoff |
|---|---|---|---|---|---|
70_30 (no options) | $59.7M | $58.3M | -76.9% | 1.18 | - |
70_30_cc05 (CC only) | $38.0M | $37.2M | -68.7% | 1.16 | - |
70_30_put15 (put only) | $33.5M | $32.7M | -76.1% | 1.09 | $16.2M / $7.1M |
70_30_cc05_put05 | $15.7M | $15.3M | -60.5% | 1.02 | $20.0M / $12.2M |
70_30_cc05_put10 | $17.4M | $17.0M | -64.3% | 1.04 | $13.7M / $6.5M |
70_30_cc05_put15 | $20.1M | $19.7M | -66.7% | 1.06 | $8.7M / $3.7M |
Focused test: 70_30 vs 70_30_collar_05
70_30_collar_05 is 70_30_cc05_put05: same 70% stock / 30% X3 sleeve, plus a 5% covered call and 5% protective put on the stock sleeve.
| Window | 70_30 NAV | Collar NAV | 70_30 DD | Collar DD | Winner |
|---|---|---|---|---|---|
full_real_options_2019_01_to_2025_04 | $37.2M | $12.4M | −76.9% | −58.6% | 70_30 NAV |
down_strong_2022_01_to_2023_01 | $0.13M | $0.24M | −74.0% | −51.0% | collar |
flat_2022_08_to_2025_08 | $1.17M | $1.33M | −61.0% | −43.4% | collar |
up_strong_2019_06_to_2022_06 | $32.6M | $8.0M | −61.3% | −46.5% | 70_30 NAV |
up_strong_2023_01_to_2026_01 | $4.08M | $2.40M | −61.0% | −43.5% | 70_30 NAV |
bad_x3_2021_11_to_2023_06 | $0.43M | $0.53M | −76.4% | −57.5% | collar |
Across all 27 preset periods: collar wins 14, bare 70/30 wins 13. The collar usually wins drawdown; it only wins NAV when the period has enough bear/chop damage for the put payoff to matter.
1.6 - Stock-only collar
stockonlyends at $9.23M pre-tax / $8.97M post-tax, but with -73.6% MaxDD.stock_only_collar_05reduces MaxDD to -45.3%, but terminal NAV is only $0.68M pre-tax / $0.65M post-tax.- Wider stock-only collars are less restrictive but still weak:
cc05+put15ends at $1.06M pre-tax / $1.02M post-tax with -58.0% MaxDD. - The old "Pick 1" read was an artifact of double-counted covered-call premium. In the pure model, the collar buys drawdown control by giving up too much TSLA upside.
| Strategy | NAV | Post-tax NAV | DD | Sharpe | CC assigned |
|---|---|---|---|---|---|
stockonly (no collar) | $9.23M | $8.97M | -73.6% | 0.88 | - |
stock_only_collar_05 (cc05+put05) | $0.68M | $0.65M | -45.3% | 0.19 | 39% |
stock_only_collar_05_credit_only (cc05+put05 when net credit) | $8.63M | $8.45M | -60.6% | 0.92 | 34% |
stock_only_collar_07 (cc07+put07) | $0.77M | $0.74M | -52.0% | 0.26 | 35% |
stock_only_collar_05_put10 | $0.82M | $0.79M | -52.7% | 0.27 | 39% |
stock_only_collar_05_put15 | $1.06M | $1.02M | -58.0% | 0.36 | 39% |
Why it fails as an anchor: the put is not free. In the corrected pure run, the stock-only cc05+put05 sleeve collects $2.33M of call premium, spends $2.38M on puts, receives $1.41M of put payoff, and gives up TSLA upside through call assignments. The collar narrows the path but clips too much of TSLA's upside to compound.
Read: use a stock-only collar only when drawdown reduction is the purpose. It is no longer a candidate for a high-compounding safe sleeve.
1.7 - Credit-only stock-only collar
stock_only_collar_05_credit_onlyopens the cc05+put05 collar only when expected covered-call premium is greater than the put cost.- If the put is richer than the call, the strategy skips both option legs for that cycle and remains bare stock.
- Result: it sells 38 collars across 88 cycles, versus 88/88 for the always-on collar.
| Strategy | NAV | Post-tax NAV | DD | Sharpe | Collars sold |
|---|---|---|---|---|---|
stockonly | $9.23M | $8.97M | -73.6% | 0.88 | 0 / 88 |
stock_only_collar_05 | $0.68M | $0.65M | -45.3% | 0.19 | 88 / 88 |
stock_only_collar_05_credit_only | $8.63M | $8.45M | -60.6% | 0.92 | 38 / 88 |
Read: the credit gate fixes the worst issue with the always-on collar: it refuses to pay net debit for protection when the put is richer than the call. That recovers most of bare stock's compounding, but skipping protection in debit months means drawdown remains much closer to bare stock than to the always-on collar.
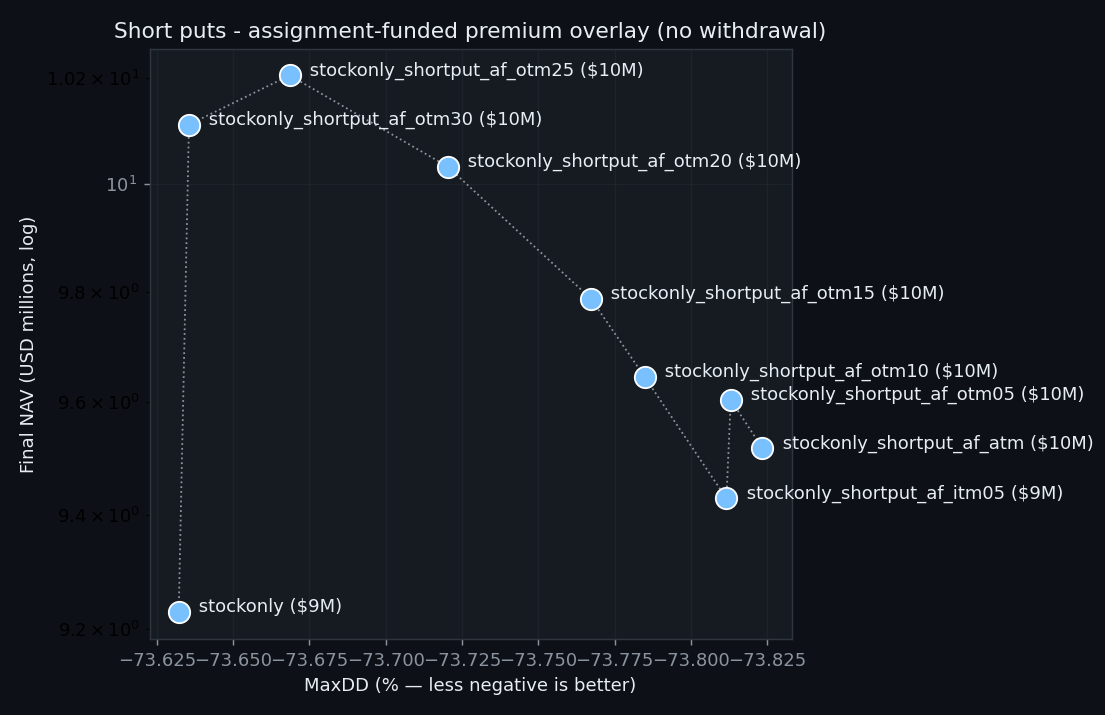
1.8 - Short puts (assignment-funded)
Test: sell monthly TSLA puts around a $3K/cycle premium target, but keep all cash inside the account. Strike ladder: 30%, 25%, 20%, 15%, 10%, 5% OTM, ATM, and 5% ITM. Assignment-funded mode keeps shares invested, caps contracts by owned shares, and sells shares only if assignment happens. Put premium remains portfolio cash and is reinvested on the next rebalance.
| Strategy | Mode | Final NAV | MaxDD | Sharpe | Put premium | Assign% |
|---|---|---|---|---|---|---|
stockonly | baseline, no withdrawal | $8.97M | -73.6% | 0.88 | n/a | n/a |
shortput_af_otm30 | assignment-funded, no withdrawal | $9.83M | -73.6% | 0.90 | $0.25M | 1% |
shortput_af_otm25 | assignment-funded, no withdrawal | $9.92M | -73.7% | 0.90 | $0.26M | 3% |
shortput_af_otm20 | assignment-funded, no withdrawal | $9.75M | -73.7% | 0.90 | $0.27M | 9% |
shortput_af_otm15 | assignment-funded, no withdrawal | $9.51M | -73.8% | 0.89 | $0.28M | 11% |
shortput_af_otm10 | assignment-funded, no withdrawal | $9.38M | -73.8% | 0.89 | $0.29M | 20% |
shortput_af_otm05 | assignment-funded, no withdrawal | $9.34M | -73.8% | 0.89 | $0.30M | 32% |
shortput_af_atm | assignment-funded, no withdrawal | $9.25M | -73.8% | 0.89 | $0.33M | 47% |
shortput_af_itm05 | assignment-funded, no withdrawal | $9.17M | -73.8% | 0.89 | $0.34M | 56% |
Default last_close_close variant, post-tax NAV. Assignment-funded rows are no-withdrawal stock-only overlays with no X3 sleeve; OTM25 is the best tested row: $9.92M vs $8.97M for bare stock, with almost unchanged drawdown.
Mechanism:
- Assignment-funded: keep shares invested until assignment. Contract count is capped by owned shares, and the tested rows here do not withdraw cash from the account.
- Farther OTM is not free: OTM25 beats OTM20 in this history because assignment losses fall faster than premium falls. OTM30 then slips because the premium becomes too thin.
- Assignment risk still arrives exactly in bad months: OTM25 is assigned in 3 of the 7 monthly drops worse than -20%, and never in the milder down buckets. The premium helps, but it does not remove TSLA drawdown exposure.
- Premium minus intrinsic loss is positive but path-dependent: OTM25 collects about $261K and loses about $71K to assignment intrinsic loss, net about +$190K. That is historical realized tail luck, not a guarantee.
Winner response buckets - shortput_af_otm25:
| TSLA monthly move | Cycles | Share of cycles | Assigned | Avg strategy P&L | Avg premium | Avg assignment loss |
|---|---|---|---|---|---|---|
| <= -20% | 7 | 8.0% | 3 | -24.6% | $3.1K | $10.1K |
| -20% to -10% | 11 | 12.5% | 0 | -13.6% | $3.1K | $0 |
| -10% to 0% | 22 | 25.0% | 0 | -4.7% | $3.0K | $0 |
| 0% to 10% | 19 | 21.6% | 0 | +4.8% | $2.9K | $0 |
| 10% to 20% | 10 | 11.4% | 0 | +13.3% | $3.0K | $0 |
| > 20% | 19 | 21.6% | 0 | +34.5% | $2.9K | $0 |
Timing/regime robustness: OTM25 is the best default no-withdrawal assignment-funded row. It behaves almost exactly like stock in ordinary down, flat, and up months; the edge is the premium collected in months that avoid the historical tail.
Conclusion: stockonly_shortput_af_otm25 is worth keeping in the candidate set as a stock-only income overlay, but with a tail-risk warning. It improves NAV modestly versus bare stock in this history, but it does not solve drawdown: MaxDD stays around -74%. This is not a Priority-1 drawdown solution.
Section 2 - Shortlist
Head-to-head of pure strategies surviving Section 1. The living-expense withdrawal overlay is intentionally deferred.
Survivors of Section 1 + cross-lever search
0_100remains the raw-NAV ceiling: $688.3M pre-tax / $671.9M post-tax, -86.5% MaxDD.70_30without options ends at $59.7M pre-tax / $58.3M post-tax, -76.9% MaxDD.70_30_cc05_put15is the strongest tested pure 70/30 cc05 collar row by NAV: $20.1M pre-tax / $19.7M post-tax, -66.7% MaxDD.stock_only_collar_05_credit_onlynearly preserves bare-stock NAV at $8.6M pre-tax / $8.5M post-tax, but MaxDD is still -60.6%.stock_only_collar_05is not a pick: $0.68M pre-tax / $0.65M post-tax, -45.3% MaxDD, weak Sharpe.
Material change: the lever chapters now separate pure mechanics from the later withdrawal/income constraint. The next decision is which pure structure is worth testing with the $3K/cycle overlay.
Section 4 - Definitions
Full strategy specs for the legacy stock collar and 70/30 collar mechanics. The stock-only collar is kept for reproduction, not as a current recommendation after corrected accounting.
Legacy specs below: these mechanics are still useful for reproducing the old strategy definitions, but stock_only_collar_05 is no longer a recommended Pick 1 after the corrected collar accounting. Treat the “Pick” labels in this spec section as legacy names until the next recommendation rebuild.
4.1 · stock_only_collar_05 (legacy base, no longer Pick 1)
One-line: 100% TSLA stock + monthly covered call 5% OTM + monthly protective put 5% OTM. No leverage, no X3 sleeve, no withdrawals in the base — the _w3kusd overlay (below) adds the $3K/cycle pull.
Composition (single sleeve)
- Equity: N TSLA shares (whole shares; sub-share residual stays as small stock-cash balance).
- CC leg: short floor(N/100) call contracts, strike 5% OTM, ~30d to expiry. Premium credited to cash.
- Put leg: long floor(N/100) put contracts, strike 5% OTM, same expiry. Cost debited from cash.
- Cash pocket: small — used to pay put cost and reinvest any leftover into shares each cycle.
Monthly rhythm (one cycle)
Run once per month on the first trading day. ~30d expiry on all options.
- Sell N/100 CCs at strike just above S × 1.05. Broker option chain → TSLA → calls → ~30d expiry → strike one increment ABOVE 5% OTM target. Example: S=$200 → target $210 → available strikes $207.5/$212.5 → sell $212.5. Round AWAY from spot (never closer-to-money). Cap at floor(N/100) contracts. Premium credited to cash.
- Buy N/100 puts at strike just below S × 0.95. Same chain → puts → same expiry → strike one increment BELOW 5% OTM. Example: S=$200 → target $190 → strikes $192.5/$187.5 → buy $187.5. Round AWAY from spot. Funded from CC premium first; top up from stock cash if put cost > premium (rare at cc05+put05).
- Reinvest leftover CC premium into shares. After paying for the put, residual =
premium − put_cost. Use it to buy whole TSLA shares at spot. Sub-share residual stays as tiny stock-cash balance. Cash does NOT pile up over time — the strategy compounds by adding shares each cycle when premium is positive. Seesrc/sleeves.py:cc_salestep 7. - Wait to expiry (~30d). No mid-cycle action. TSLA between strikes: both legs expire worthless, no action. TSLA > CC strike at expiry: shares assigned (broker auto). TSLA < put strike at expiry: cash-settled
(put_strike − spot) × 100per contract. - Next first-of-month: re-establish. If called away last cycle, re-buy at new spot using the assignment cash (whole-share rounding). Else hold. Back to step 1.
Rules & conventions
- Strike rounding: always pick strike further from spot. Closer = more premium but more upside lost (CC) / more downside exposed (put). "5% OTM" = minimum, not exact.
- Expiry: backtest uses ~30d. At a US broker, that's the standard third-Friday monthly. Anchor (first vs last trading day of the month) creates ~$3–4M variance in 7yr final NAV but doesn't change mechanics.
- No mid-cycle adjustments. Don't roll, don't close early. Hold to expiry. Simplicity is part of the spec — adds robustness, removes timing optionality.
- Order: CC first (collect premium), then put (pay with it).
Pricing (for backtest reproduction)
- Historical option chain first: opening premiums and daily open-option marks use exact listed TSLA option-chain mids from
data/real_options.parquetwhenever that contract/date exists. Daily NAV therefore marks the actual open call/put rather than a nearby synthetic contract. - Fallback model: when the historical chain is missing (or after the chain coverage ends), the backtest falls back to Black-Scholes European pricing. Opening fallback uses
calibrated_sigma(HV30, VIX, option_type); daily marks use HV30 × 1.12. r = 1-month T-bill, dividend yield = 0. - Live execution: use live chain mid-quotes at the close on cycle day. Broker fills happen at mid or worse; explicit slippage beyond the current CC haircut is not yet modeled.
4.2 · 70_30_cc05_put05 (standalone 70_30 base)
One-line: 70% TSLA stock + monthly collar (5% CC + 5% put), plus 30% X3 leveraged TSLA sleeve (MA10 gate + earnings exit). No options on the X3 sleeve. No rebalancing between the two halves (no trim). No withdrawals in the base — the _w3kusd overlay (below) adds the $3K/cycle pull on the safe sleeve.
Composition (two parallel sleeves, fixed initial weights)
- Safe sleeve (70% of starting capital): identical mechanics to §4.1 base — 70% of NAV in TSLA shares + monthly cc05 + monthly put05. No withdrawals from the base.
- Leveraged sleeve (30% of starting capital): X3 TSLA cert (AVA 1, orderbookId 1041282 — NOT AVA 3). MA10 gate on TSLA close + quarterly earnings exit. No options written on the cert. No withdrawals from this sleeve under any overlay.
- No cross-sleeve rebalance. The two sleeves drift apart over time and that's intentional. (Pick 2/3 layers an annual lock-in on top — see Implementation notes.)
Monthly rhythm — safe sleeve (70% half)
Identical to §4.1 base, applied only to the 70% safe sleeve's share count.
- Sell CCs at strike just above S × 1.05 on floor(N_safe / 100) contracts. Round away from spot.
- Buy puts at strike just below S × 0.95, same contract count, same expiry. Round away from spot.
- Reinvest leftover CC premium (= premium − put_cost) into safe-sleeve TSLA shares at spot.
- Hold to expiry (~30d). No mid-cycle action.
- Next first-of-month: if assigned, re-buy with assignment cash. Back to step 1.
Daily rhythm — X3 sleeve (30% half)
No options. Just a leveraged TSLA position with two exit/entry gates. Check daily at close. State is "in" (holding cert) or "out" (cash).
- Daily mark (if in): X3 sleeve NAV updates as
prev × (close / prev_close) ^ leverage, where leverage ≈ 3. Modeled per AVA 1 cert (annual drag 0% after 2026-05 recalibration matches the real cert within 2pp over 6yr — see §1.1). - MA10 gate — exit: if close < 10-day moving average of TSLA close → liquidate the cert at close, sit in cash until step 3.
- MA10 gate — re-entry: if close ≥ 10-day MA AND not within an earnings block → buy back the cert at close. Apply trade-cost haircut (spread + fee, ~0.3% per round trip).
- Earnings exit (added 2026-05-10): on TSLA quarterly earnings days → forced flat for that day, regardless of MA10. Re-entry on the NEXT trading day at OPEN if MA10 says in (uses
(close / open) ^ leveragefor that day's return). If MA10 says out at next-day open, stay flat. - Earnings dates: from
data/tsla_earnings.csv— pre-loaded list of 30 quarterly dates 2019-01-30 → 2026-04-22 (Tesla IR + yfinance, cross-checked). Future cycles: pull from Tesla IR.
Rules & conventions
- Cert choice: AVA 1 (orderbookId 1041282), NOT AVA 3. AVA 1 beats AVA 3 by ~5.4%/yr over 3.3yr overlap despite wider spread — drag advantage > spread cost. Backtest is calibrated against AVA 1's real price series; residual error ~$9.7K over 3.16yr in Phase 0a validation, dominated by deposit timing not model error.
- Whole-cert sizing: AVA 1 trades in whole shares of the cert (low denomination, <$100/cert) — sub-cert residual stays as small SEK cash balance on the leveraged sleeve.
- FX: AVA 1 is SEK-denominated; the backtest uses TSLA price (USD) directly under the assumption that USDSEK drift is small over the horizon and that FX is hedged or absorbed. Live execution: monitor USDSEK; if conviction is high, hedge or accept the FX as additional exposure.
- No options on the X3 sleeve. The MA10 + earnings gates are the only risk management; structural downside is capped by the 30% sleeve weight, not by puts.
Pricing
- Options: same as §4.1 — calibrated BS for backtest, live chain mid for execution.
- X3 sleeve: the backtest synthesizes the cert's NAV path from TSLA close — no separate pricing needed. The synthetic was validated against the real AVA 1 cert tape in Phase 0a (2026-05-10).
4.3 · _w3kusd overlay — $3K/cycle withdrawal
One-line: a behavioral overlay applied on top of any base strategy. Pulls $3K to bank each cycle from option premium; if premium falls short, sells available shares to top up. The current lever chapters do not apply this overlay; it is deferred to the income-constraint rebuild.
Mechanics (slots between base steps 2 and 3)
- Pull $3K to bank from option premium still in cash after hedge costs.
- Share-sale fallback: if remaining premium < $3K, sell available shares at spot to top up to the full $3K.
- Reinvest residual = premium minus hedge cost minus withdrawal into shares at spot.
Where it applies
- Single-sleeve tests: overlay applies to that strategy's stock/options sleeve.
- Two-level tests: overlay should apply only to the safe sleeve. The leveraged sleeve runs withdrawal-free so it can compound.
- Current status: old pick-specific
_w3kusdconclusions are stale after the collar accounting correction and should be rebuilt before use.
Why cash doesn't accumulate: leftover premium is reinvested after the withdrawal. Share count grows only when premium exceeds hedge cost plus the $3K withdrawal.
stockonly85_1570_300_100Default variant; ordering robust across all 6 timing variants.